Answered step by step
Verified Expert Solution
Question
1 Approved Answer
A company that makes cola drinks states that the mean caffeine content per 12-ounce bottle of cola is 50 milligrams. You want to test

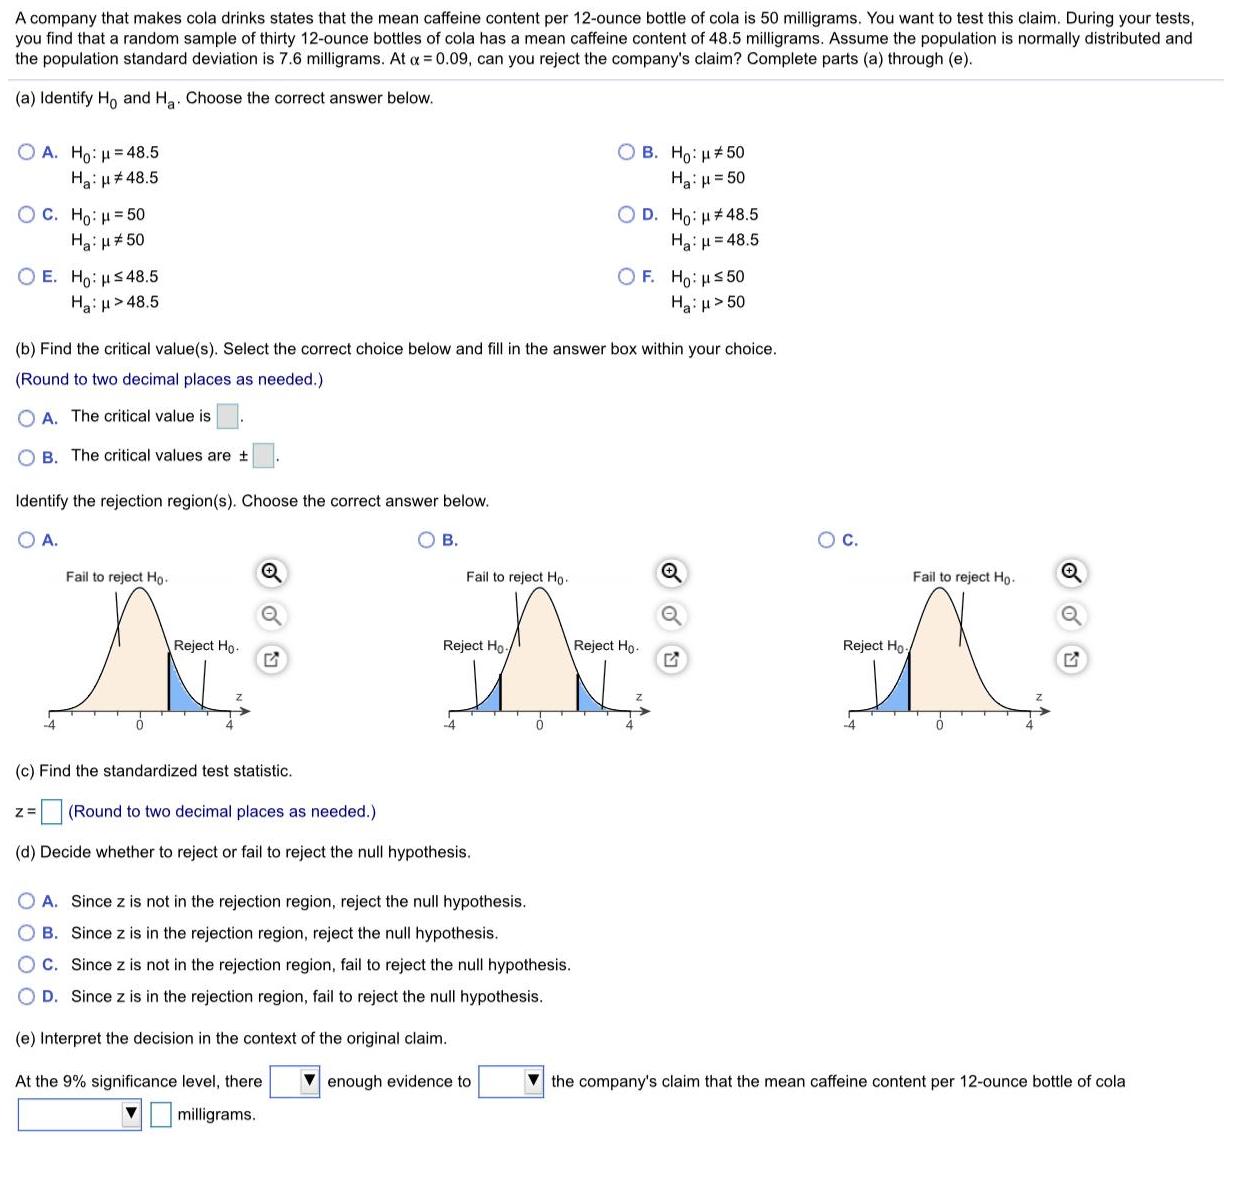
A company that makes cola drinks states that the mean caffeine content per 12-ounce bottle of cola is 50 milligrams. You want to test this claim. During your tests, you find that a random sample of thirty 12-ounce bottles of cola has a mean caffeine content of 48.5 milligrams. Assume the population is normally distributed and the population standard deviation is 7.6 milligrams. At a = 0.09, can you reject the company's claim? Complete parts (a) through (e). (a) Identify Ho and Ha. Choose the correct answer below. O A. Ho: = 48.5 Ha: u#48.5 O B. Ho: H#50 HaiH= 50 O C. H : = 50 Hai u# 50 O D. Ho: u# 48.5 Hai H= 48.5 O E. Ho: uS48.5 Hai u> 48.5 O F. Ho: us 50 Hai H> 50 (b) Find the critical value(s). Select the correct choice below and fill in the answer box within your choice. (Round to two decimal places as needed.) O A. The critical value is O B. The critical values are t Identify the rejection region(s). Choose the correct answer below. O A. O B. Oc. Fail to reject Ho. Fail to reject Ho. Fail to reject Ho. Reject Ho. Reject Ho./ Reject Ho. Reject Ho. (c) Find the standardized test statistic. (Round to two decimal places as needed.) (d) Decide whether to reject or fail to reject the null hypothesis. O A. Since z is not in the rejection region, reject the null hypothesis. B. Since z is in the rejection region, reject the null hypothesis. C. Since z is not in the rejection region, fail to reject the null hypothesis. D. Since z is in the rejection region, fail to reject the null hypothesis. (e) Interpret the decision in the context of the original claim. At the 9% significance level, there V enough evidence to V the company's claim that the mean caffeine content per 12-ounce bottle of cola milligrams.
Step by Step Solution
★★★★★
3.29 Rating (143 Votes )
There are 3 Steps involved in it
Step: 1

Get Instant Access to Expert-Tailored Solutions
See step-by-step solutions with expert insights and AI powered tools for academic success
Step: 2

Step: 3

Ace Your Homework with AI
Get the answers you need in no time with our AI-driven, step-by-step assistance
Get Started


