Finance Question very hard please help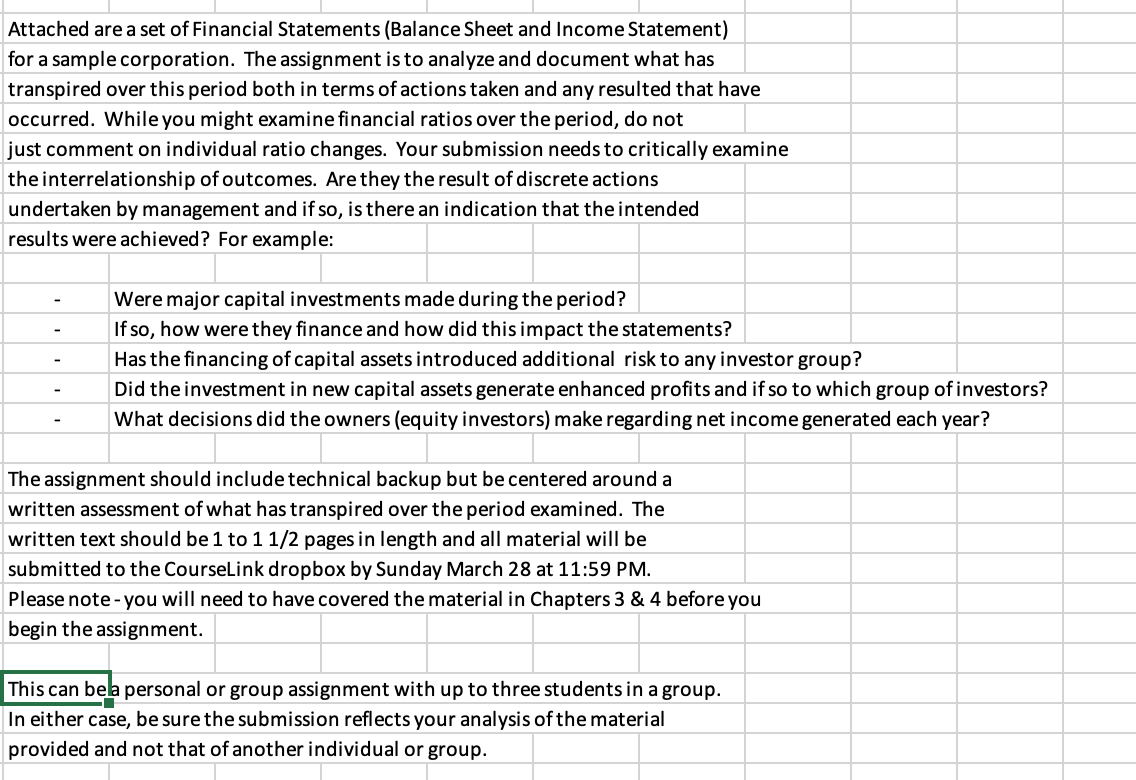
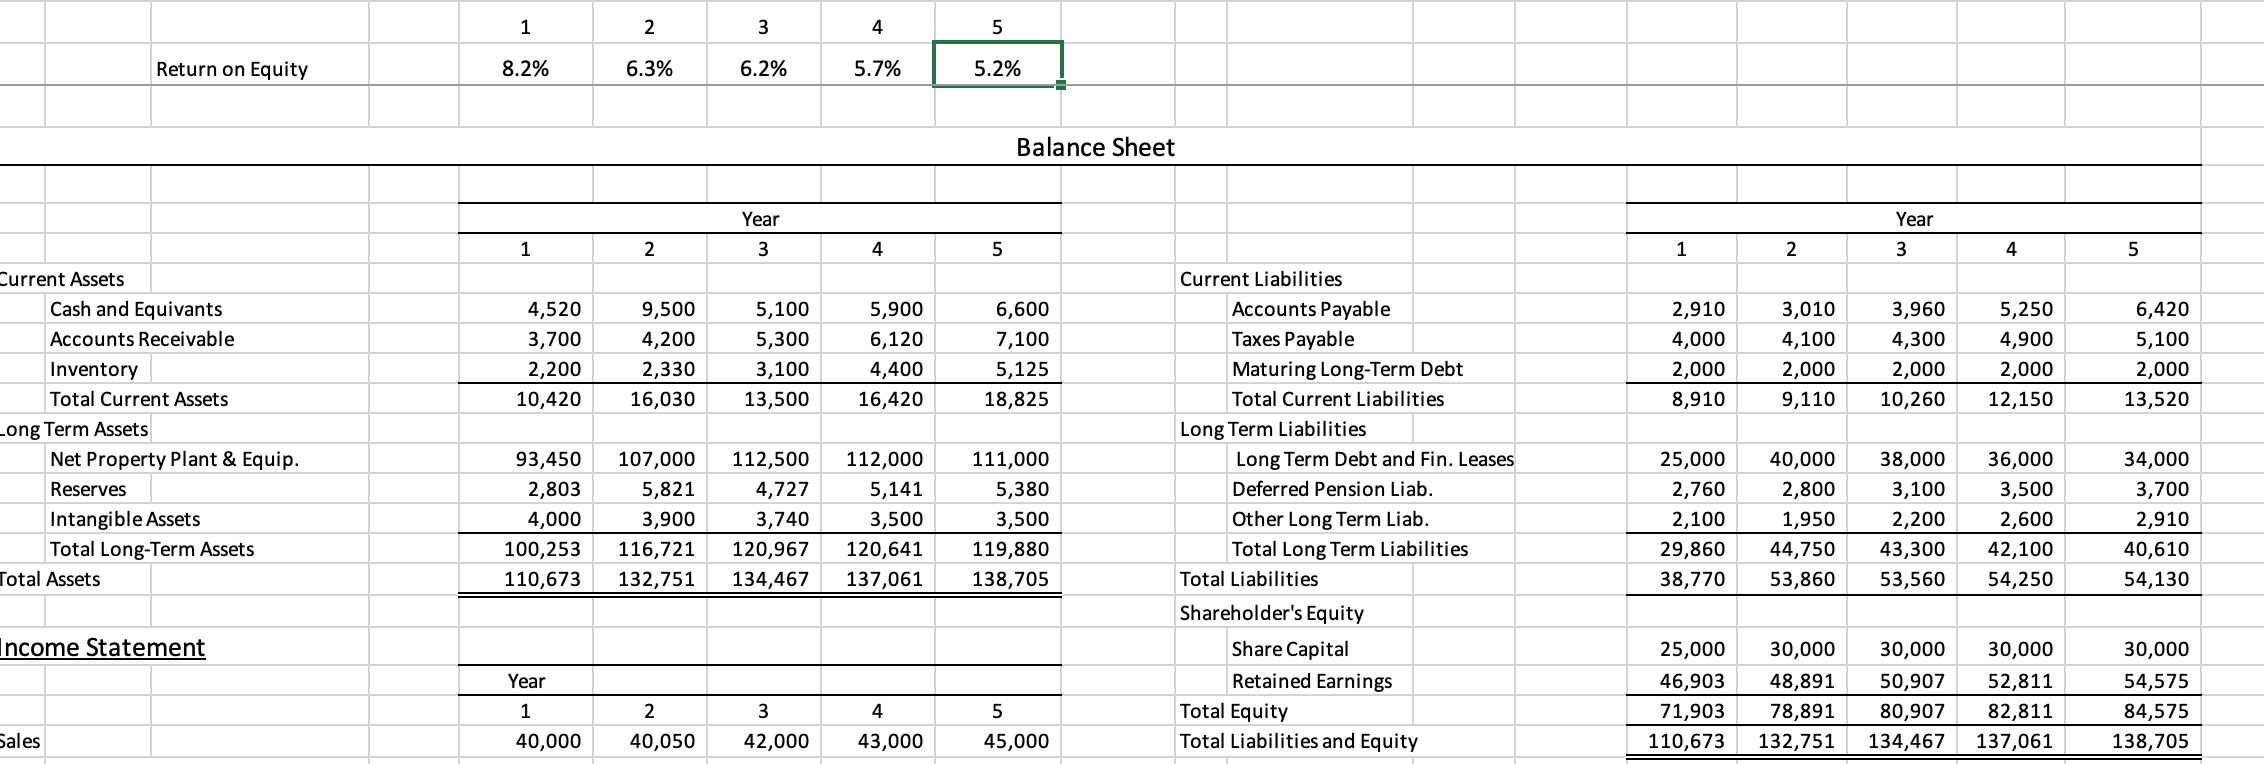
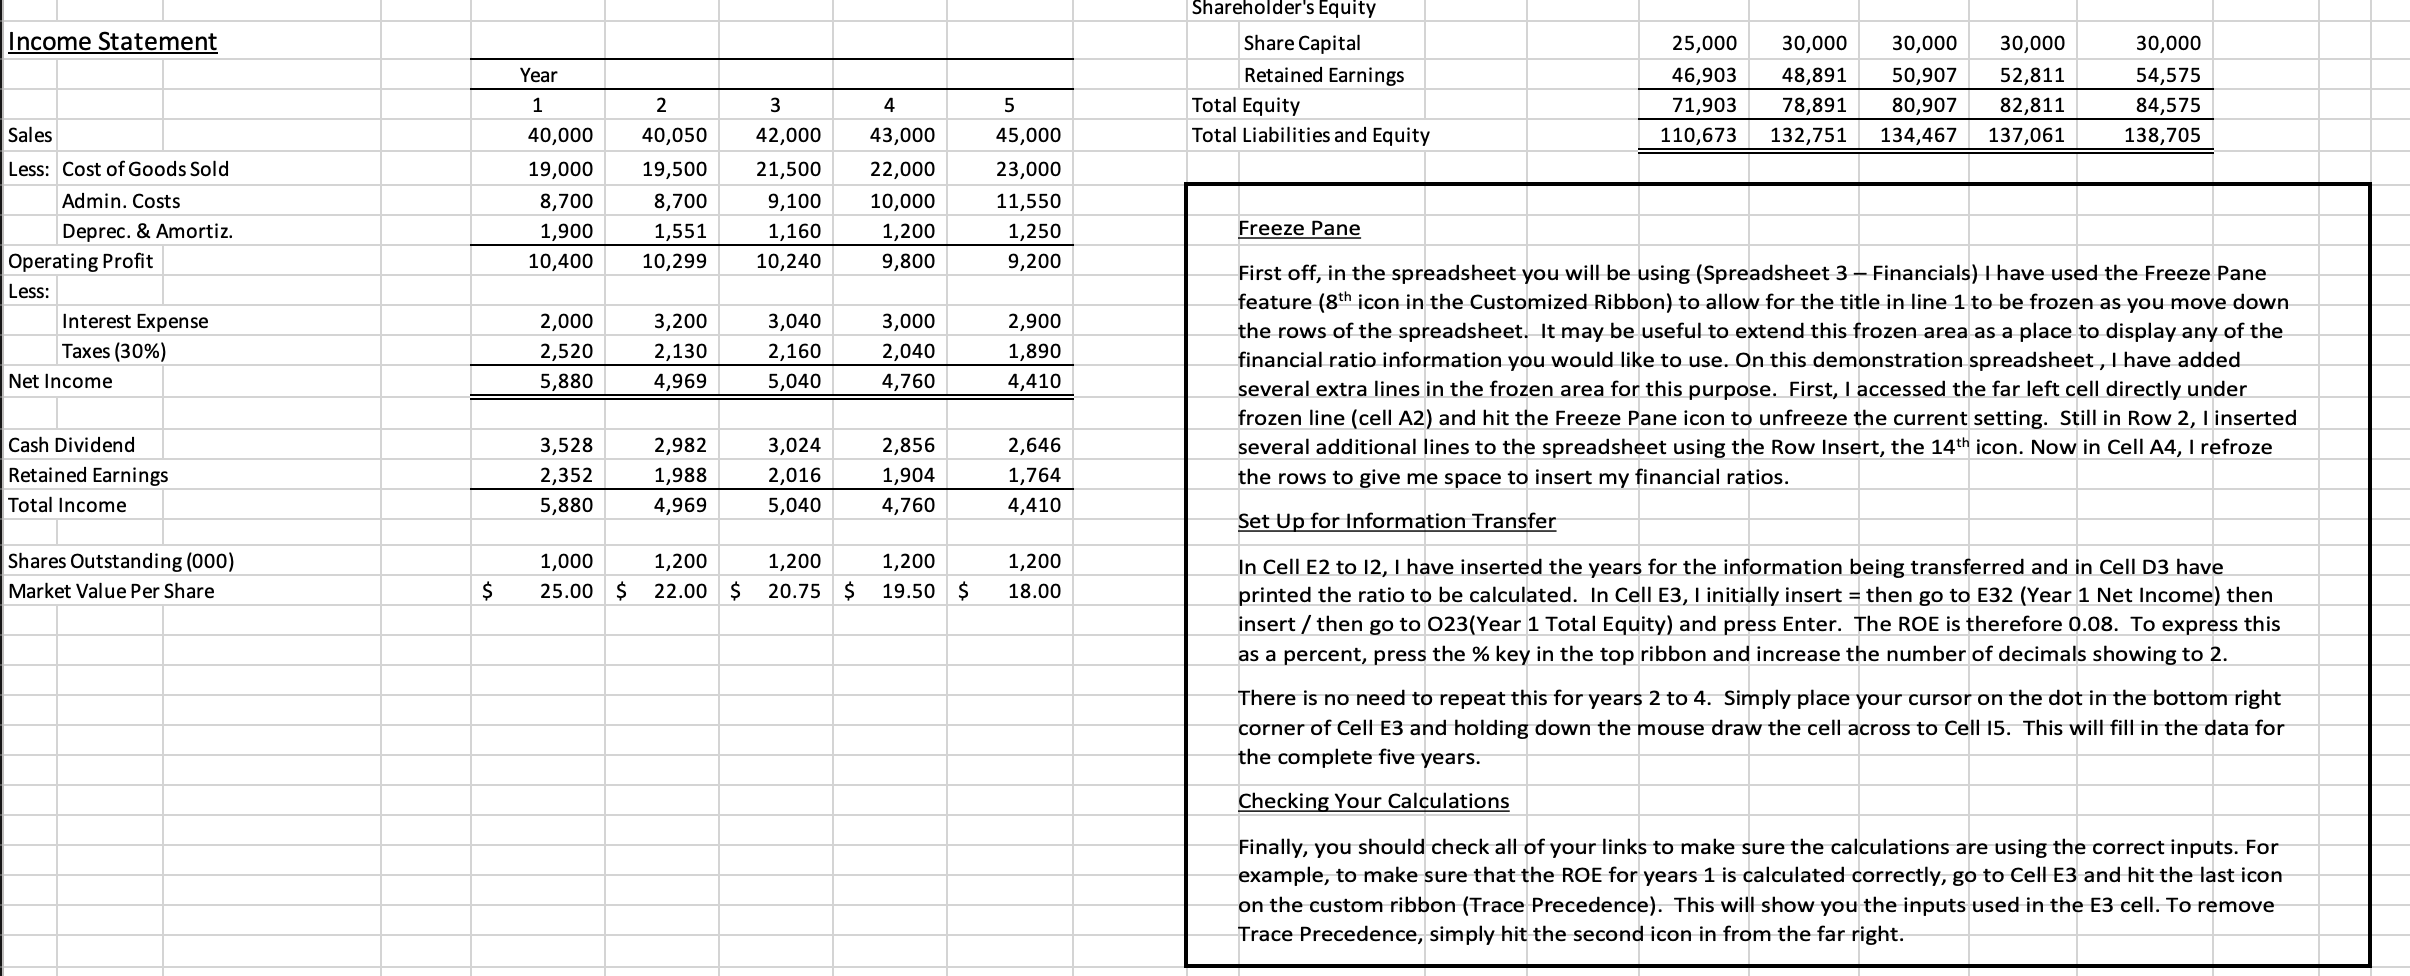
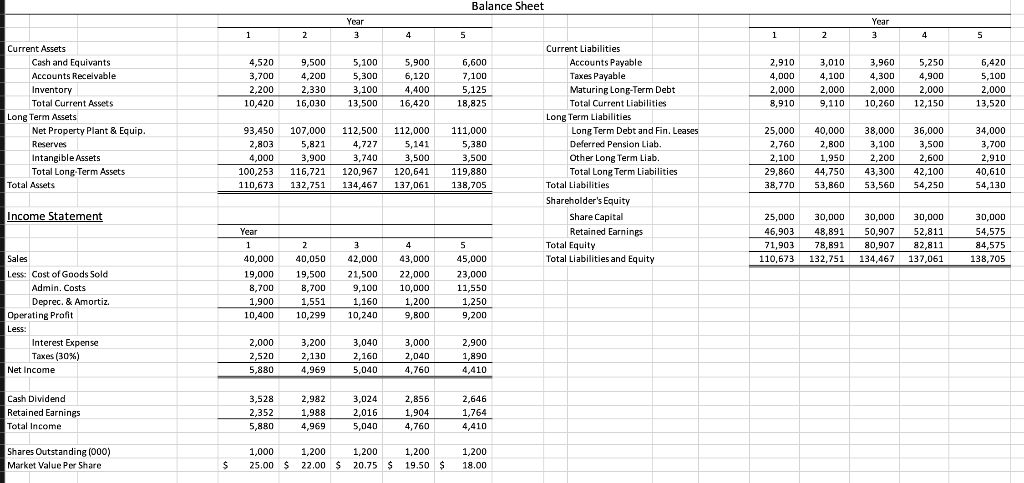
Attached are a set of Financial Statements (Balance Sheet and Income Statement) for a sample corporation. The assignment is to analyze and document what has transpired over this period both in terms of actions taken and any resulted that have occurred. While you might examine financial ratios over the period, do not just comment on individual ratio changes. Your submission needs to critically examine the interrelationship of outcomes. Are they the result of discrete actions undertaken by management and if so, is there an indication that the intended results were achieved ? For example: Were major capital investments made during the period? If so, how were they finance and how did this impact the statements? Has the financing of capital assets introduced additional risk to any investor group? Did the investment in new capital assets generate enhanced profits and if so to which group of investors? What decisions did the owners (equity investors) make regarding net income generated each year? The assignment should include technical backup but be centered around a written assessment of what has transpired over the period examined. The written text should be 1 to 1 1/2 pages in length and all material will be submitted to the CourseLink dropbox by Sunday March 28 at 11:59 PM. Please note - you will need to have covered the material in Chapters 3 & 4 before you begin the assignment. This can bela personal or group assignment with up to three students in a group. In either case, be sure the submission reflects your analysis of the material provided and not that of another individual or group. 1 2 3 4 5 Return on Equity 8.2% 6.3% 6.2% 5.7% 5.2% Balance Sheet Year Year 1 2. 3 4 5 1 2 3 4 5 4,520 3,700 2,200 10,420 9,500 4,200 2,330 16,030 5,100 5,300 3,100 13,500 5,900 6,120 4,400 16,420 6,600 7,100 5,125 18,825 2,910 4,000 2,000 8,910 3,010 4,100 2,000 9,110 3,960 4,300 2,000 10,260 5,250 4,900 2,000 12,150 6,420 5,100 2,000 13,520 Current Assets Cash and Equivants Accounts Receivable Inventory Total Current Assets Long Term Assets Net Property Plant & Equip. Reserves Intangible Assets Total Long-Term Assets Total Assets 93,450 2,803 4,000 100,253 110,673 107,000 5,821 3,900 116,721 132,751 112,500 4,727 3,740 120,967 134,467 112,000 5,141 3,500 120,641 137,061 111,000 5,380 3,500 119,880 138,705 Current Liabilities Accounts Payable Taxes Payable Maturing Long-Term Debt Total Current Liabilities Long Term Liabilities Long Term Debt and Fin. Leases Deferred Pension Liab. Other Long Term Liab. Total Long Term Liabilities Total Liabilities Shareholder's Equity Share Capital Retained Earnings Total Equity Total Liabilities and Equity 25,000 2,760 2,100 29,860 38,770 40,000 2,800 1,950 44,750 53,860 38,000 3,100 2,200 43,300 53,560 36,000 3,500 2,600 42,100 54,250 34,000 3,700 2,910 40,610 54,130 Income Statement Year 25,000 46,903 71,903 110,673 30,000 48,891 78,891 132,751 30,000 50,907 80,907 134,467 30,000 52,811 82,811 137,061 30,000 54,575 84,575 138,705 1 2 3 4 5 45,000 Sales 40,000 40,050 42,000 43,000 Income Statement Year Shareholder's Equity Share Capital Retained Earnings Total Equity Total Liabilities and Equity 25,000 46,903 71,903 110,673 30,000 48,891 78,891 132,751 30,000 50,907 80,907 134,467 30,000 52,811 82,811 137,061 30,000 54,575 84,575 138,705 4 5 1 40,000 19,000 8,700 1,900 10,400 Sales Less: Cost of Goods Sold Admin. Costs Deprec. & Amortiz. Operating Profit Less: Interest Expense Taxes (30%) Net Income 2 40,050 19,500 8,700 1,551 10,299 3 42,000 21,500 9,100 1,160 10,240 43,000 22,000 10,000 1,200 9,800 45,000 23,000 11,550 1,250 9,200 Freeze Pane 2,000 2,520 5,880 3,200 2,130 4,969 3,040 2,160 5,040 3,000 2,040 4,760 2,900 1,890 4,410 First off, in the spreadsheet you will be using (Spreadsheet 3 - Financials) I have used the Freeze Pane feature (8th icon in the Customized Ribbon) to allow for the title in line 1 to be frozen as you move down the rows of the spreadsheet. It may be useful to extend this frozen area as a place to display any of the financial ratio information you would like to use. On this demonstration spreadsheet, I have added several extra lines in the frozen area for this purpose. First, I accessed the far left cell directly under frozen line (cell A2) and hit the Freeze Pane icon to unfreeze the current setting. Still in Row 2, I inserted several additional lines to the spreadsheet using the Row Insert, the 14th icon. Now in Cell A4, I refroze the rows to give me space to insert my financial ratios. Cash Dividend Retained Earnings Total Income 3,528 2,352 5,880 2,982 1,988 4,969 3,024 2,016 5,040 2,856 1,904 4,760 2,646 1,764 4,410 Set Up for Information Transfer Shares Outstanding (000) Market Value Per Share 1,000 1,200 25.00 $ 22.00 $ 1,200 20.75 $ 1,200 19.50 $ 1,200 18.00 $ In Cell E2 to 12, I have inserted the years for the information being transferred and in Cell D3 have printed the ratio to be calculated. In Cell E3, I initially insert = then go to E32 (Year 1 Net Income) then insert / then go to 023(Year 1 Total Equity) and press Enter. The ROE is therefore 0.08. To express this as a percent, press the % key in the top ribbon and increase the number of decimals showing to 2. There is no need to repeat this for years 2 to 4. Simply place your cursor on the dot in the bottom right corner of Cell E3 and holding down the mouse draw the cell across to Cell 15. This will fill in the data for the complete five years. Checking Your Calculations Finally, you should check all of your links to make sure the calculations are using the correct inputs. For example, to make sure that the ROE for years 1 is calculated correctly, go to Cell and hit the last icon on the custom ribbon (Trace Precedence). This will show you the inputs used in the E3 cell. To remove Trace Precedence, simply hit the second icon in from the far right. Balance Sheet Year 3 Year 3 1 2 4 5 1 2 4 5 4,520 3,700 2,200 10,420 9,500 4,200 2,330 16,030 5,100 5,300 3,100 13,500 5,900 6,120 4,400 16,420 6,600 7,100 5,125 18,825 2,910 4,000 2,000 8,910 3,010 4,100 2,000 9,110 3,960 4,300 2,000 10,260 5,250 4,900 2,000 12,150 6,420 5,100 2,000 13,520 Current Assets Cash and Equivants Accounts Receivable Inventory Total Current Assets Long Term Assets Net Property Plant & Equip. Reserves Intangible Assets Total Long Term Assets Total Assets 93,450 2,803 4,000 100,253 110,673 107,000 5,821 3,900 116,721 132,751 112,500 4,727 3,740 120,967 134,467 112,000 5,141 3,500 120,641 137,061 111,000 5,380 3,500 119,880 138,705 Current Liabilities Accounts Payable Taxes Payable Maturing Long-Term Debt Total Current Liabilities Long Term Liabilities Long Term Debt and Fin. Leases Deferred Pension Liab. Other Long Term Liab. Total Long Term Liabilities Total Liabilities Shareholder's Equity Share Capital Retained Earnings Total Equity Total Liabilities and Equity 25,000 2,760 2,100 29,860 38,770 40,000 2,800 1,950 44.750 53,860 38,000 3,100 2,200 43,300 53,560 36,000 3,500 2,600 42,100 54,250 34,000 3,700 2,910 40,610 54,130 Income Statement 25,000 46,903 71,903 110,673 30,000 48,891 78,891 132,751 30,000 50,907 80,907 134,467 30,000 52,811 82,811 137,061 30,000 54,575 84,575 138,705 3 4 Sales Less: Cost of Goods Sold Admin. Costs Deprec. & Amortiz. Operating Profit Less Interest Expense Taxes (30%) Net Income Year 1 40,000 19,000 8,700 1,900 10,400 2 40,050 19,500 8,700 1,551 10,299 42,000 21,500 9,100 1,160 10,240 43,000 22,000 10,000 1,200 9,800 5 45,000 23,000 11,550 1,250 9,200 2.000 2,520 5,880 3,200 2,130 4,969 3,040 2,160 5,040 3,000 2,040 4,760 2,900 1,890 4,410 Cash Dividend Retained Earnings Total Income 3,528 2,352 5,880 2,982 1,988 4,969 3,024 2,016 5,040 2,856 1,904 4,760 2,646 1,764 4,410 Shares Outstanding (000) Market Value Per Share 1,000 1,200 1,200 25.00 $ 22.00 $ 22.00 $ 20.75 $ 1,200 19.50 $ 1,200 18.00 $