

Answered step by step
Verified Expert Solution
Question
1 Approved Answer
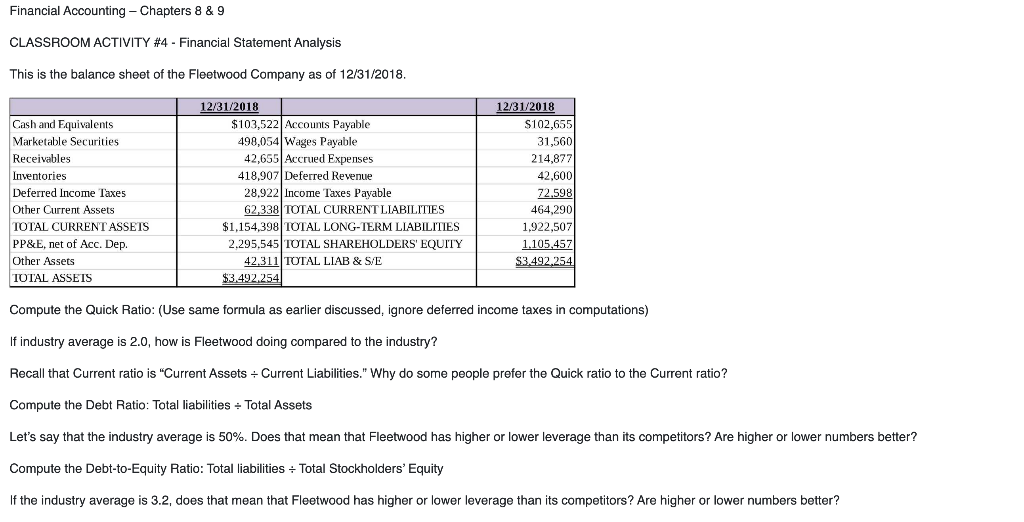
Financial Accounting - Chapters 8 & 9 CLASSROOM ACTIVITY #4 - Financial Statement Analysis This is the balance sheet of the Fleetwood Company as of
Step by Step Solution
There are 3 Steps involved in it
Step: 1

Get Instant Access to Expert-Tailored Solutions
See step-by-step solutions with expert insights and AI powered tools for academic success
Step: 2

Step: 3
Ace Your Homework with AI
Get the answers you need in no time with our AI-driven, step-by-step assistance
Get Started
The Credit Risk Of Complex Derivatives
Authors: Erik Banks
3rd Edition
1403916691, 9781403916693