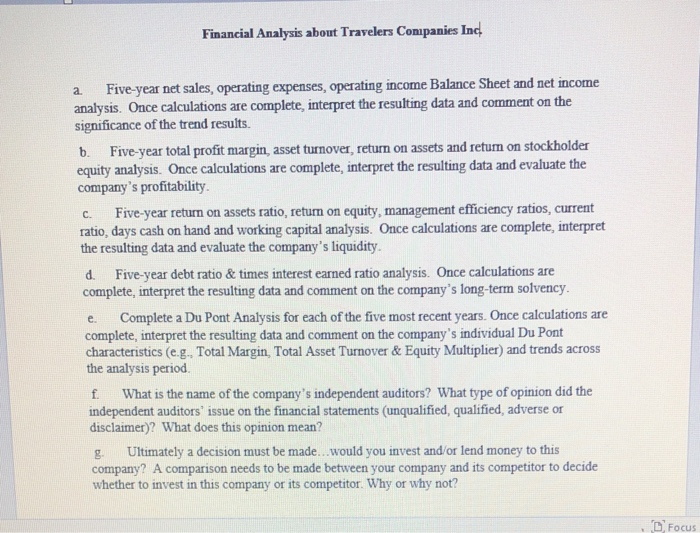
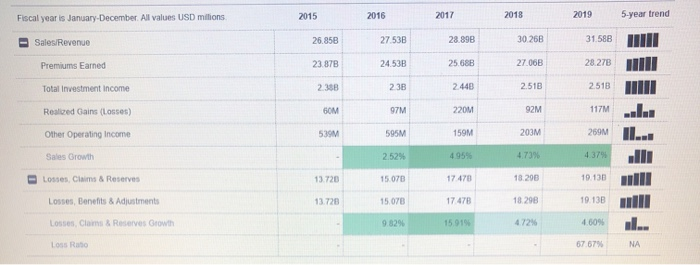
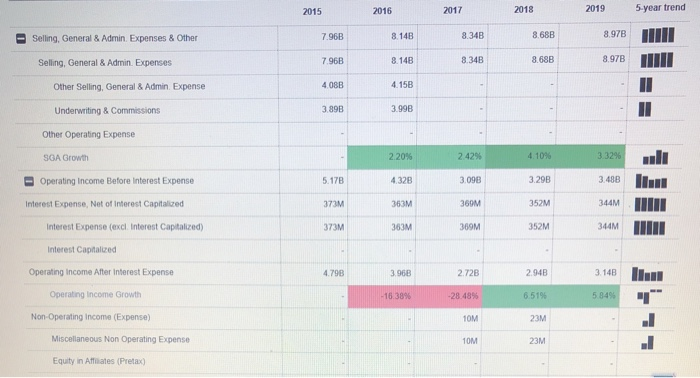
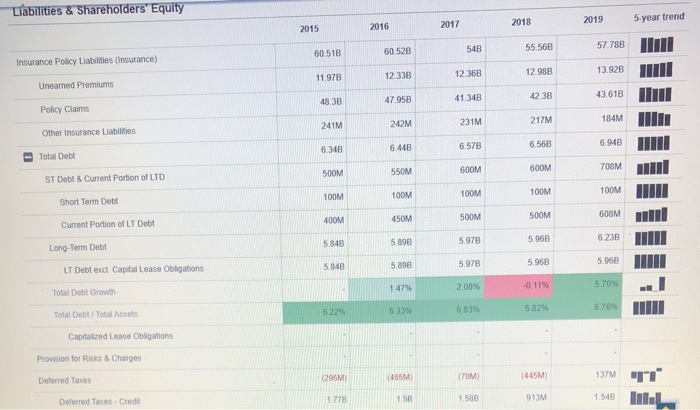
Financial Analysis about Travelers Companies Inc a. C Five-year net sales, operating expenses, operating income Balance Sheet and net income analysis. Once calculations are complete, interpret the resulting data and comment on the significance of the trend results. b. Five-year total profit margin, asset turnover, return on assets and retum on stockholder equity analysis. Once calculations are complete, interpret the resulting data and evaluate the company's profitability Five-year return on assets ratio, return on equity, management efficiency ratios, current ratio, days cash on hand and working capital analysis. Once calculations are complete, interpret the resulting data and evaluate the company's liquidity d Five-year debt ratio & times interest earned ratio analysis. Once calculations are complete, interpret the resulting data and comment on the company's long-term solvency. Complete a Du Pont Analysis for each of the five most recent years. Once calculations are complete, interpret the resulting data and comment on the company's individual Du Pont characteristics (e.g. Total Margin. Total Asset Turnover & Equity Multiplier) and trends across the analysis period f What is the name of the company's independent auditors? What type of opinion did the independent auditors' issue on the financial statements (unqualified, qualified adverse or disclaimer)? What does this opinion mean? Ultimately a decision must be made. Would you invest and/or lend money to this company? A comparison needs to be made between your company and its competitor to decide whether to invest in this company or its competitor. Why or why not? e. g Focus 2015 2016 2017 2018 Fiscal year is January-December All values USD milions 2019 5-year trend Sales/Revenue 26.85B 27.53B 28 89B 30 26B 31.588 Premiums Earned 23.87B 24.53B 25.68B 27.06B 28.27B Total Investment income 2.358 23B 2440 2.518 2.518 Realized Gains (Losses) 6 97M 220M 92M 117M Other Operating Income 539M 595M 159M 203M 259M Sales Growth 2.52% 4.95 4.73% 4.37% Losses Cims & Reserves 13.720 15.078 17 470 18.298 19.130 Losses, Benefits & Adjustments 13.728 15.078 17 478 18.298 19.133 Losos, com & Reserves Growth 9.8290 1591 4.60% Loss Raho 67 67% NA 2015 2016 2017 2018 2019 5 year trend 7.96B Selling, General & Admin Expenses & Other 8 14B 8.34B 8.68B 8.97B 7.96B Selling, General & Admin Expenses 8.148 8.34B 8.68B 8.97B Other Selling, General & Admin Expense 4.088 4.158 Underwriting & Commissions 3.89B 3.99B Other Operating Expense SGA Growth 2.20% 2.42% 4.10% 3.32% Operating Income Before Interest Expense 5.170 4.328 3.098 3.29B 3.488 Interest Expense, Net of interest Capitalized 373M 363M 360M 352M 344M Interest Expense (excl. Interest Capitalized) 373M 363M 369M 352M 344M Interest Capitalized Operating Income After interest Expense 4.79B 3.96B 2.728 2.948 3.14B Operating Income Growth -16.38% -28.489 6.519 5 8495 Non-Operating income (Expense) 10M 23M Miscellaneous Non Operating Expense 10M 23M Equity in Alates (Pretax) Assets 2016 2017 2018 2015 2019 5 year trend Fiscal year is January-December. All values USD millions 307M 344M 373M 380M 494M Cash Only - 19.219 12.05% 8.43% 32.44% Cash Growth 70.49B 72.58 70.478 72.288 77 88B 0 Total Investment Assets 60 560 6052B 67 59B 67.458 Total Fixed Income Securities Investment 73 07 60.550 60.42B 67.498 Bonds 67.37B 73.03B 93M 95M 79M 50M 110M Redeemable Preferred Stock 705M 732M 453M 368M Total Equity Securities Investment 425M 543M 339M Common Stocks 603M 383M 316M 162M 129M 116 52M Non Redeemable Preferred Stock 42M 989M 928M Real Estate Assets 932M 904M 963M Mortgago Policy & Other Loans Other investments 8.12B 8.31B 3.538 356B 3.42BIL Investments Growth 0.03% 2059 03196 7.70% Yield On Investment 3.34% NA Premium Balance Receivables 168 15 5B 7 148 7.518 7.918 IL Premium Balance Growth -2539 -54209 5.07% 5.379 Liabilities & Shareholders' Equity 2019 2018 5 year trend 2015 2016 2017 60.51B 60.52B 548 55 56B 57.78B Insurance Policy Liabilities (Insurance) 11.97B 12.338 12.36B 12.988 13.92B Unearned Premiums 47.95B 48.3B 4134B 42.3B 43.61B Policy Claims 241M 242M 231M 184M 217M Other Insurance Liabilities 6.34B 6.94B 6.44B 6.57B 6.56B Total Debt 600M 500M 600M 708M 550M ST Debt & Current Portion of LTD 100M 100M 100M 100M 100M Short Term Debt 608M 400M 450M 500M 500M Current Portion of LT Debt 5.84B 5.898 5.978 6.23B 5.96B Long-Term Debt 5.84B 5.898 5.97B 5.96B 5.96B LT Debt exd. Capital Lease Obligations 2.00% 1.47% -0.1196 5.709 Total Debt Growth 6.33% 6.839 6.82 6229 6.769 Total Debt/Total Assets Capitalized Lease Obligations Provision for Risks & Charges (296M Deferred Taces (465M (70M) (445) 137M 1778 150 Deferred Taxes - Credit 1.580 913M 1.54B Financial Analysis about Travelers Companies Inc a. C Five-year net sales, operating expenses, operating income Balance Sheet and net income analysis. Once calculations are complete, interpret the resulting data and comment on the significance of the trend results. b. Five-year total profit margin, asset turnover, return on assets and retum on stockholder equity analysis. Once calculations are complete, interpret the resulting data and evaluate the company's profitability Five-year return on assets ratio, return on equity, management efficiency ratios, current ratio, days cash on hand and working capital analysis. Once calculations are complete, interpret the resulting data and evaluate the company's liquidity d Five-year debt ratio & times interest earned ratio analysis. Once calculations are complete, interpret the resulting data and comment on the company's long-term solvency. Complete a Du Pont Analysis for each of the five most recent years. Once calculations are complete, interpret the resulting data and comment on the company's individual Du Pont characteristics (e.g. Total Margin. Total Asset Turnover & Equity Multiplier) and trends across the analysis period f What is the name of the company's independent auditors? What type of opinion did the independent auditors' issue on the financial statements (unqualified, qualified adverse or disclaimer)? What does this opinion mean? Ultimately a decision must be made. Would you invest and/or lend money to this company? A comparison needs to be made between your company and its competitor to decide whether to invest in this company or its competitor. Why or why not? e. g Focus 2015 2016 2017 2018 Fiscal year is January-December All values USD milions 2019 5-year trend Sales/Revenue 26.85B 27.53B 28 89B 30 26B 31.588 Premiums Earned 23.87B 24.53B 25.68B 27.06B 28.27B Total Investment income 2.358 23B 2440 2.518 2.518 Realized Gains (Losses) 6 97M 220M 92M 117M Other Operating Income 539M 595M 159M 203M 259M Sales Growth 2.52% 4.95 4.73% 4.37% Losses Cims & Reserves 13.720 15.078 17 470 18.298 19.130 Losses, Benefits & Adjustments 13.728 15.078 17 478 18.298 19.133 Losos, com & Reserves Growth 9.8290 1591 4.60% Loss Raho 67 67% NA 2015 2016 2017 2018 2019 5 year trend 7.96B Selling, General & Admin Expenses & Other 8 14B 8.34B 8.68B 8.97B 7.96B Selling, General & Admin Expenses 8.148 8.34B 8.68B 8.97B Other Selling, General & Admin Expense 4.088 4.158 Underwriting & Commissions 3.89B 3.99B Other Operating Expense SGA Growth 2.20% 2.42% 4.10% 3.32% Operating Income Before Interest Expense 5.170 4.328 3.098 3.29B 3.488 Interest Expense, Net of interest Capitalized 373M 363M 360M 352M 344M Interest Expense (excl. Interest Capitalized) 373M 363M 369M 352M 344M Interest Capitalized Operating Income After interest Expense 4.79B 3.96B 2.728 2.948 3.14B Operating Income Growth -16.38% -28.489 6.519 5 8495 Non-Operating income (Expense) 10M 23M Miscellaneous Non Operating Expense 10M 23M Equity in Alates (Pretax) Assets 2016 2017 2018 2015 2019 5 year trend Fiscal year is January-December. All values USD millions 307M 344M 373M 380M 494M Cash Only - 19.219 12.05% 8.43% 32.44% Cash Growth 70.49B 72.58 70.478 72.288 77 88B 0 Total Investment Assets 60 560 6052B 67 59B 67.458 Total Fixed Income Securities Investment 73 07 60.550 60.42B 67.498 Bonds 67.37B 73.03B 93M 95M 79M 50M 110M Redeemable Preferred Stock 705M 732M 453M 368M Total Equity Securities Investment 425M 543M 339M Common Stocks 603M 383M 316M 162M 129M 116 52M Non Redeemable Preferred Stock 42M 989M 928M Real Estate Assets 932M 904M 963M Mortgago Policy & Other Loans Other investments 8.12B 8.31B 3.538 356B 3.42BIL Investments Growth 0.03% 2059 03196 7.70% Yield On Investment 3.34% NA Premium Balance Receivables 168 15 5B 7 148 7.518 7.918 IL Premium Balance Growth -2539 -54209 5.07% 5.379 Liabilities & Shareholders' Equity 2019 2018 5 year trend 2015 2016 2017 60.51B 60.52B 548 55 56B 57.78B Insurance Policy Liabilities (Insurance) 11.97B 12.338 12.36B 12.988 13.92B Unearned Premiums 47.95B 48.3B 4134B 42.3B 43.61B Policy Claims 241M 242M 231M 184M 217M Other Insurance Liabilities 6.34B 6.94B 6.44B 6.57B 6.56B Total Debt 600M 500M 600M 708M 550M ST Debt & Current Portion of LTD 100M 100M 100M 100M 100M Short Term Debt 608M 400M 450M 500M 500M Current Portion of LT Debt 5.84B 5.898 5.978 6.23B 5.96B Long-Term Debt 5.84B 5.898 5.97B 5.96B 5.96B LT Debt exd. Capital Lease Obligations 2.00% 1.47% -0.1196 5.709 Total Debt Growth 6.33% 6.839 6.82 6229 6.769 Total Debt/Total Assets Capitalized Lease Obligations Provision for Risks & Charges (296M Deferred Taces (465M (70M) (445) 137M 1778 150 Deferred Taxes - Credit 1.580 913M 1.54B
