Answered step by step
Verified Expert Solution
Question
1 Approved Answer
Financial Analysis Simulation: Data Detective HW Below is the list of companies, match financial statements to the companies. Using this information, together with your analysis
Financial Analysis Simulation: Data Detective HW
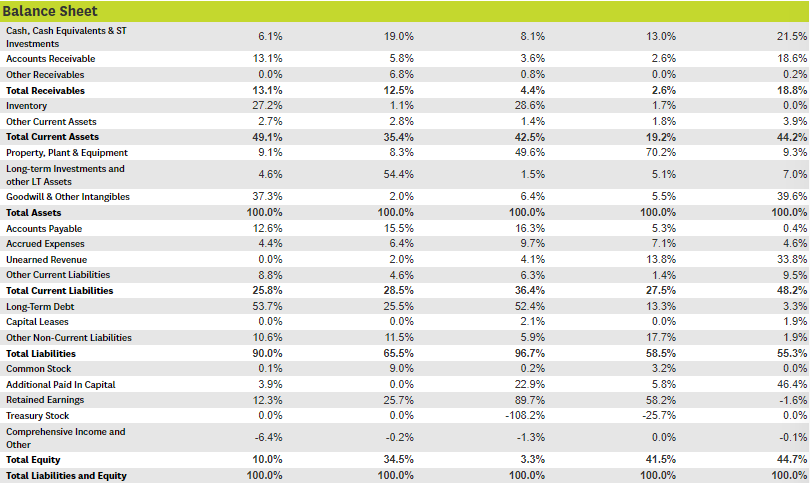
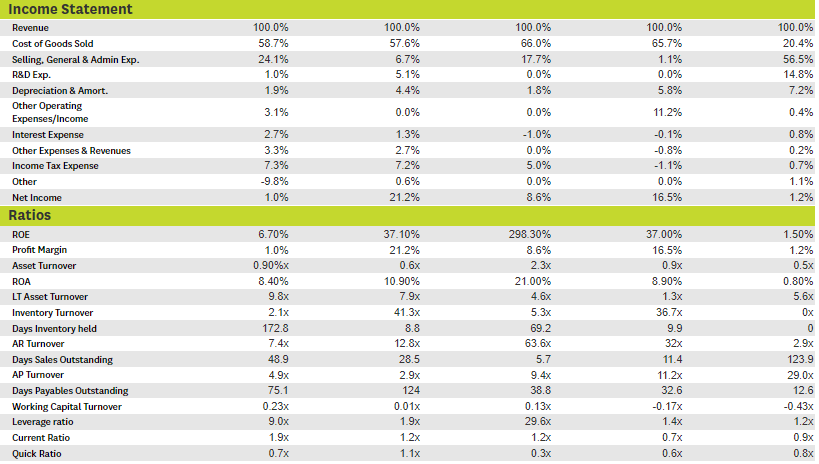
Below is the list of companies, match financial statements to the companies. Using this information, together with your analysis of the financials on the Analyze page, to identify the company that matches the financial statements and write a rationale.
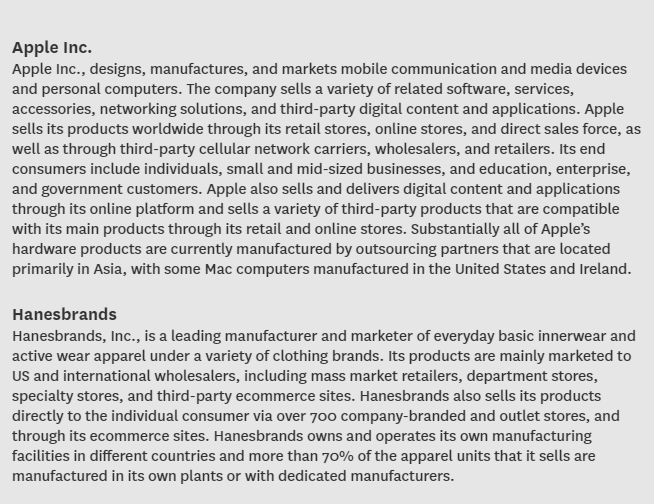
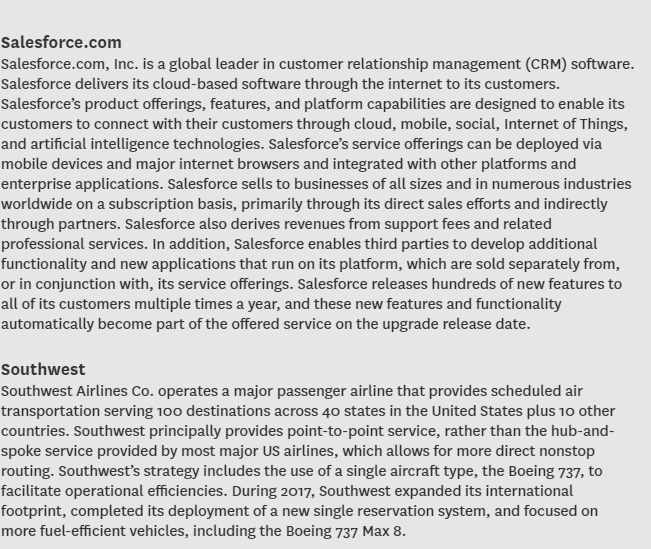
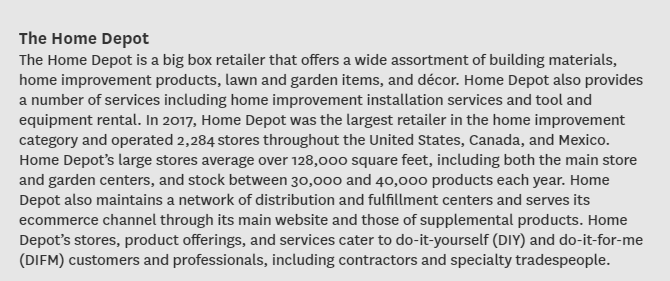
Balance Sheet Cash, Cash Equivalents & ST Investments Accounts Receivable Other Receivables Total Receivables Inventory Other Current Assets Total Current Assets Property. Plant & Equipment Long-term Investments and other LT Assets Goodwill & Other Intangibles Total Assets Accounts Payable Accrued Expenses Unearned Revenue Other Current Liabilities Total Current Liabilities Long-Term Debt Capital Leases Other Non-Current Liabilities Total Liabilities Common Stock Additional Paid In Capital Retained Earnings Treasury Stock Comprehensive Income and Other Total Equity Total Liabilities and Equity 6.1% 13.1% 0.0% 13.1% 27.2% 2.7% 49.1% 9.1% 4.6% 37.3% 100.0% 12.6% 4.4% 0.0% 8.8% 25.8% 53.7% 0.0% 10.6% 90.0% 0.1% 3.9% 12.3% 0.0% -6.4% 10.0% 100.0% 19.0% 5.8% 6.8% 12.5% 1.1% 2.8% 35.4% 8.3% 54.4% 2.0% 100.0% 15.5% 6.4% 2.0% 4.6% 28.5% 25.5% 0.0% 11.5% 65.5% 9.0% 0.0% 25.7% 0.0% -0.2% 34.5% 100.0% 8.1% 3.6% 0.8% 4.4% 28.6% 1.4% 42.5% 49.6% 1.5% 6.4% 100.0% 16.3% 9.7% 4.1% 6.3% 36.4% 52.4% 2.1% 5.9% 96.7% 0.2% 22.9% 89.7% -108.2% -1.3% 3.3% 100.0% 13.0% 2.6% 0.0% 2.6% 1.7% 1.8% 19.2% 70.2% 5.1% 5.5% 100.0% 5.3% 7.1% 13.8% 1.4% 27.5% 13.3% 0.0% 17.7% 58.5% 3.2% 5.8% 58.2% -25.7% 0.0% 41.5% 100.0% 21.5% 18.6% 0.2% 18.8% 0.0% 3.9% 44.2% 9.3% 7.0% 39.6% 100.0% 0.4% 4.6% 33.8% 9.5% 48.2% 3.3% 1.9% 1.9% 55.3% 0.0% 46.4% -1.6% 0.0% -0. 44.7% 100.0% Income Statement Revenue Cost of Goods Sold Selling, General & Admin Exp. R&D Exp. Depreciation & Amort. Other Operating Expenses/Income Interest Expense Other Expenses & Revenues Income Tax Expense Other Net Income Ratios ROE Profit Margin Asset Turnover ROA LT Asset Turnover Inventory Turnover Days Inventory held AR Turnover Days Sales Outstanding AP Turnover Days Payables Outstanding Working Capital Turnover Leverage ratio Current Rati Quick Ratio 100.0% 58.7% 24.1% 1.0% 1.9% 3.1% 2.7% 3.3% 7.3% -9.8% 1.0% 6.70% 1.0% 0.90%x 8.40% 9.8x 2.1x 172.8 7.4x 48.9 4.9x 75.1 0.23x 9.0x 1.9x 0.7x 100.0% 57.6% 6.7% 5.1% 4.4% 0.0% 1.3% 2.7% 7.2% 0.6% 21.2% 37.10% 21.2% 0.6x 10.90% 7.9x 41.3x 8.8 12.8x 28.5 2.9x 124 0.01x 1.9x 1.2 1.1x 100.0% 66.0% 17.7% 0.0% 1.8% 0.0% -1.0% 0.0% 5.0% 0.0% 8.6% 298.30% 8.6% 2.3x 21.00% 4.6x 5.3x 69.2 63.6x 5.7 9.4x 38.8 0.13x 29.6x 1.2x 0.3x 100.0% 65.7% 1.1% 0.0% 5.8% 11.2% -0.1% -0.8% -1.1% 0.0% 16.5% 37.00% 16.5% 0.9x 8.90% 1.3x 36.7x 9.9 32x 11.4 11.2x 32.6 -0.17x 1.4x 0.7x 0.6x 100.0% 20.4% 56.5% 14.8% 7.2% 0.4% 0.8% 0.2% 0.7% 1.1% 1.2% 1.50% 1.2% 0.5x 0.80% 5.6x 0x 0 2.9x 123.9 29.0x 12.6 -0.43x 1.2x 0.9x 0.8x Apple Inc. Apple Inc., designs, manufactures, and markets mobile communication and media devices and personal computers. The company sells a variety of related software, services, accessories, networking solutions, and third-party digital content and applications. Apple sells its products worldwide through its retail stores, online stores, and direct sales force, as well as through third-party cellular network carriers, wholesalers, and retailers. Its end consumers include individuals, small and mid-sized businesses, and education, enterprise, and government customers. Apple also sells and delivers digital content and applications through its online platform and sells a variety of third-party products that are compatible with its main products through its retail and online stores. Substantially all of Apple's hardware products are currently manufactured by outsourcing partners that are located primarily in Asia, with some Mac computers manufactured in the United States and Ireland. Hanesbrands Hanesbrands, Inc., is a leading manufacturer and marketer of everyday basic innerwear and active wear apparel under a variety of clothing brands. Its products are mainly marketed to US and international wholesalers, including mass market retailers, department stores, specialty stores, and third-party ecommerce sites. Hanesbrands also sells its products directly to the individual consumer via over 700 company-branded and outlet stores, and through its ecommerce sites. Hanesbrands owns and operates its own manufacturing facilities in different countries and more than 70% of the apparel units that it sells are manufactured in its own plants or with dedicated manufacturers. Salesforce.com Salesforce.com, Inc. is a global leader in customer relationship management (CRM) software. Salesforce delivers its cloud-based software through the internet to its customers. Salesforce's product offerings, features, and platform capabilities are designed to enable its customers to connect with their customers through cloud, mobile, social, Internet of Things, and artificial intelligence technologies. Salesforce's service offerings can be deployed via mobile devices and major internet browsers and integrated with other platforms and enterprise applications. Salesforce sells to businesses of all sizes and in numerous industries worldwide on a subscription basis, primarily through its direct sales efforts and indirectly through partners. Salesforce also derives revenues from support fees and related professional services. In addition, Salesforce enables third parties to develop additional functionality and new applications that run on its platform, which are sold separately from, or in conjunction with, its service offerings. Salesforce releases hundreds of new features to all of its customers multiple times a year, and these new features and functionality automatically become part of the offered service on the upgrade release date. Southwest Southwest Airlines Co. operates a major passenger airline that provides scheduled air transportation serving 100 destinations across 40 states in the United States plus 10 other countries. Southwest principally provides point-to-point service, rather than the hub-and- spoke service provided by most major US airlines, which allows for more direct nonstop routing. Southwest's strategy includes the use of a single aircraft type, the Boeing 737, to facilitate operational efficiencies. During 2017, Southwest expanded its international footprint, completed its deployment of a new single reservation system, and focused on more fuel-efficient vehicles, including the Boeing 737 Max 8. The Home Depot The Home Depot is a big box retailer that offers a wide assortment of building materials, home improvement products, lawn and garden items, and dcor. Home Depot also provides a number of services including home improvement installation services and tool and equipment rental. In 2017, Home Depot was the largest retailer in the home improvement category and operated 2,284 stores throughout the United States, Canada, and Mexico. Home Depot's large stores average over 128,000 square feet, including both the main store and garden centers, and stock between 30,000 and 40,000 products each year. Home Depot also maintains a network of distribution and fulfillment centers and serves its ecommerce channel through its main website and those of supplemental products. Home Depot's stores, product offerings, and services cater to do-it-yourself (DIY) and do-it-for-me (DIFM) customers and professionals, including contractors and specialty tradespeople. Balance Sheet Cash, Cash Equivalents & ST Investments Accounts Receivable Other Receivables Total Receivables Inventory Other Current Assets Total Current Assets Property. Plant & Equipment Long-term Investments and other LT Assets Goodwill & Other Intangibles Total Assets Accounts Payable Accrued Expenses Unearned Revenue Other Current Liabilities Total Current Liabilities Long-Term Debt Capital Leases Other Non-Current Liabilities Total Liabilities Common Stock Additional Paid In Capital Retained Earnings Treasury Stock Comprehensive Income and Other Total Equity Total Liabilities and Equity 6.1% 13.1% 0.0% 13.1% 27.2% 2.7% 49.1% 9.1% 4.6% 37.3% 100.0% 12.6% 4.4% 0.0% 8.8% 25.8% 53.7% 0.0% 10.6% 90.0% 0.1% 3.9% 12.3% 0.0% -6.4% 10.0% 100.0% 19.0% 5.8% 6.8% 12.5% 1.1% 2.8% 35.4% 8.3% 54.4% 2.0% 100.0% 15.5% 6.4% 2.0% 4.6% 28.5% 25.5% 0.0% 11.5% 65.5% 9.0% 0.0% 25.7% 0.0% -0.2% 34.5% 100.0% 8.1% 3.6% 0.8% 4.4% 28.6% 1.4% 42.5% 49.6% 1.5% 6.4% 100.0% 16.3% 9.7% 4.1% 6.3% 36.4% 52.4% 2.1% 5.9% 96.7% 0.2% 22.9% 89.7% -108.2% -1.3% 3.3% 100.0% 13.0% 2.6% 0.0% 2.6% 1.7% 1.8% 19.2% 70.2% 5.1% 5.5% 100.0% 5.3% 7.1% 13.8% 1.4% 27.5% 13.3% 0.0% 17.7% 58.5% 3.2% 5.8% 58.2% -25.7% 0.0% 41.5% 100.0% 21.5% 18.6% 0.2% 18.8% 0.0% 3.9% 44.2% 9.3% 7.0% 39.6% 100.0% 0.4% 4.6% 33.8% 9.5% 48.2% 3.3% 1.9% 1.9% 55.3% 0.0% 46.4% -1.6% 0.0% -0. 44.7% 100.0% Income Statement Revenue Cost of Goods Sold Selling, General & Admin Exp. R&D Exp. Depreciation & Amort. Other Operating Expenses/Income Interest Expense Other Expenses & Revenues Income Tax Expense Other Net Income Ratios ROE Profit Margin Asset Turnover ROA LT Asset Turnover Inventory Turnover Days Inventory held AR Turnover Days Sales Outstanding AP Turnover Days Payables Outstanding Working Capital Turnover Leverage ratio Current Rati Quick Ratio 100.0% 58.7% 24.1% 1.0% 1.9% 3.1% 2.7% 3.3% 7.3% -9.8% 1.0% 6.70% 1.0% 0.90%x 8.40% 9.8x 2.1x 172.8 7.4x 48.9 4.9x 75.1 0.23x 9.0x 1.9x 0.7x 100.0% 57.6% 6.7% 5.1% 4.4% 0.0% 1.3% 2.7% 7.2% 0.6% 21.2% 37.10% 21.2% 0.6x 10.90% 7.9x 41.3x 8.8 12.8x 28.5 2.9x 124 0.01x 1.9x 1.2 1.1x 100.0% 66.0% 17.7% 0.0% 1.8% 0.0% -1.0% 0.0% 5.0% 0.0% 8.6% 298.30% 8.6% 2.3x 21.00% 4.6x 5.3x 69.2 63.6x 5.7 9.4x 38.8 0.13x 29.6x 1.2x 0.3x 100.0% 65.7% 1.1% 0.0% 5.8% 11.2% -0.1% -0.8% -1.1% 0.0% 16.5% 37.00% 16.5% 0.9x 8.90% 1.3x 36.7x 9.9 32x 11.4 11.2x 32.6 -0.17x 1.4x 0.7x 0.6x 100.0% 20.4% 56.5% 14.8% 7.2% 0.4% 0.8% 0.2% 0.7% 1.1% 1.2% 1.50% 1.2% 0.5x 0.80% 5.6x 0x 0 2.9x 123.9 29.0x 12.6 -0.43x 1.2x 0.9x 0.8x Apple Inc. Apple Inc., designs, manufactures, and markets mobile communication and media devices and personal computers. The company sells a variety of related software, services, accessories, networking solutions, and third-party digital content and applications. Apple sells its products worldwide through its retail stores, online stores, and direct sales force, as well as through third-party cellular network carriers, wholesalers, and retailers. Its end consumers include individuals, small and mid-sized businesses, and education, enterprise, and government customers. Apple also sells and delivers digital content and applications through its online platform and sells a variety of third-party products that are compatible with its main products through its retail and online stores. Substantially all of Apple's hardware products are currently manufactured by outsourcing partners that are located primarily in Asia, with some Mac computers manufactured in the United States and Ireland. Hanesbrands Hanesbrands, Inc., is a leading manufacturer and marketer of everyday basic innerwear and active wear apparel under a variety of clothing brands. Its products are mainly marketed to US and international wholesalers, including mass market retailers, department stores, specialty stores, and third-party ecommerce sites. Hanesbrands also sells its products directly to the individual consumer via over 700 company-branded and outlet stores, and through its ecommerce sites. Hanesbrands owns and operates its own manufacturing facilities in different countries and more than 70% of the apparel units that it sells are manufactured in its own plants or with dedicated manufacturers. Salesforce.com Salesforce.com, Inc. is a global leader in customer relationship management (CRM) software. Salesforce delivers its cloud-based software through the internet to its customers. Salesforce's product offerings, features, and platform capabilities are designed to enable its customers to connect with their customers through cloud, mobile, social, Internet of Things, and artificial intelligence technologies. Salesforce's service offerings can be deployed via mobile devices and major internet browsers and integrated with other platforms and enterprise applications. Salesforce sells to businesses of all sizes and in numerous industries worldwide on a subscription basis, primarily through its direct sales efforts and indirectly through partners. Salesforce also derives revenues from support fees and related professional services. In addition, Salesforce enables third parties to develop additional functionality and new applications that run on its platform, which are sold separately from, or in conjunction with, its service offerings. Salesforce releases hundreds of new features to all of its customers multiple times a year, and these new features and functionality automatically become part of the offered service on the upgrade release date. Southwest Southwest Airlines Co. operates a major passenger airline that provides scheduled air transportation serving 100 destinations across 40 states in the United States plus 10 other countries. Southwest principally provides point-to-point service, rather than the hub-and- spoke service provided by most major US airlines, which allows for more direct nonstop routing. Southwest's strategy includes the use of a single aircraft type, the Boeing 737, to facilitate operational efficiencies. During 2017, Southwest expanded its international footprint, completed its deployment of a new single reservation system, and focused on more fuel-efficient vehicles, including the Boeing 737 Max 8. The Home Depot The Home Depot is a big box retailer that offers a wide assortment of building materials, home improvement products, lawn and garden items, and dcor. Home Depot also provides a number of services including home improvement installation services and tool and equipment rental. In 2017, Home Depot was the largest retailer in the home improvement category and operated 2,284 stores throughout the United States, Canada, and Mexico. Home Depot's large stores average over 128,000 square feet, including both the main store and garden centers, and stock between 30,000 and 40,000 products each year. Home Depot also maintains a network of distribution and fulfillment centers and serves its ecommerce channel through its main website and those of supplemental products. Home Depot's stores, product offerings, and services cater to do-it-yourself (DIY) and do-it-for-me (DIFM) customers and professionals, including contractors and specialty tradespeople
Step by Step Solution
There are 3 Steps involved in it
Step: 1

Get Instant Access to Expert-Tailored Solutions
See step-by-step solutions with expert insights and AI powered tools for academic success
Step: 2

Step: 3

Ace Your Homework with AI
Get the answers you need in no time with our AI-driven, step-by-step assistance
Get Started


