Financial History: (3-year analysis of the companys performance. Your report will include the ratio results plus an explanation and analysis of each ratio. Include the ratio, its results, and what the results mean for the company. (Liquidity and Debt, Asset Management, Profitability, and Market ratios. See ratio detail below.) Were there changes in the ratios? What could have caused the change? You must include an evaluation section of what each type of (LAPM) ratio means over the three years, then an overall comparison to validate your conclusion. (Show you understand and know the ratios.)
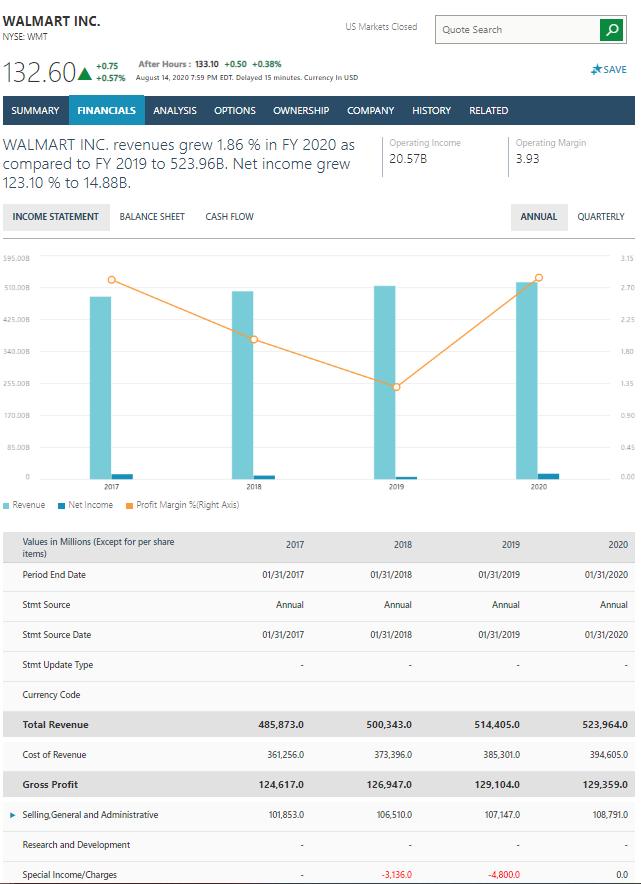
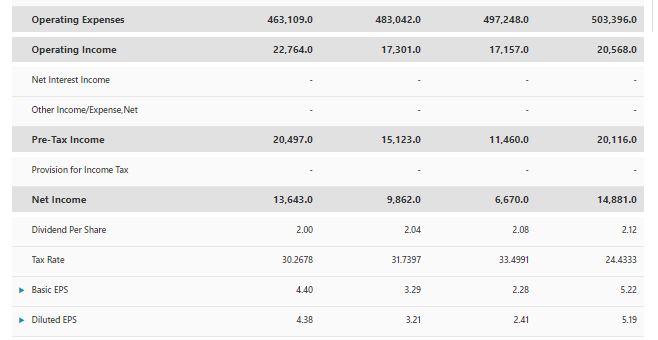
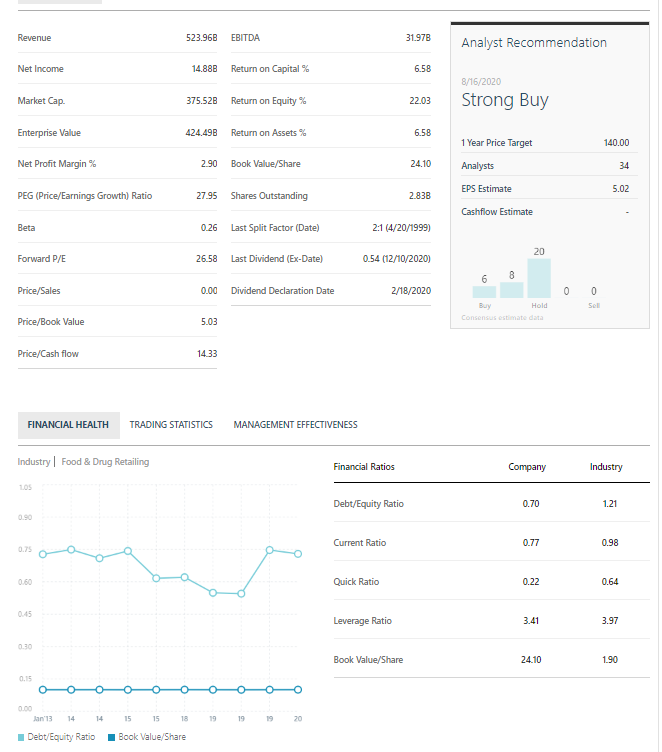
WALMART INC. NYSE: WMT US Markets Closed a Quote Search 132.60A +0.75 After Hours : 133.10 +0.50 +0.38% +0.57% August 14, 2020 7:59 PM EDT. Delayed 15 minutes. Currency In USD #SAVE SUMMARY FINANCIALS ANALYSIS OPTIONS OWNERSHIP COMPANY HISTORY RELATED WALMART INC. revenues grew 1.86 % in FY 2020 as compared to FY 2019 to 523.96B. Net income grew 123.10 % to 14.88B. Operating Income 20.57B Operating Margin 3.93 INCOME STATEMENT BALANCE SHEET CASH FLOW ANNUAL QUARTERLY 595.000 3.15 510.000 2.70 425.000 2.25 340.000 1.80 255.000 (11 1.35 170.000 090 85.00 0 0.00 2017 2018 2019 2020 Revenue Net Income Profit Margin (Right Axis) Values in Millions (Except for per share 2017 2018 2019 2020 items) Period End Date 01/31/2017 01/31/2018 01/31/2019 01/31/2020 Stmt Source Annual Annual Annual Annual Stmt Source Date 01/31/2017 01/31/2018 01/31/2019 01/31/2020 Stmt Update Type Currency Code Total Revenue 485,873.0 500,343.0 514,405.0 523,964.0 Cost of Revenue 361,256.0 373,396.0 385,301.0 394,605.0 Gross Profit 124,617.0 126,947.0 129,104.0 129,359.0 Selling General and Administrative 101,853.0 106,510,0 107.147.0 108,791.0 Research and Development Special Income/Charges -3,136.0 -4,800.0 0.0 Operating Expenses 463,109.0 483,042.0 497,248.0 503,396.0 Operating Income 22,764.0 17,301.0 17,157.0 20,568.0 Net Interest Income Other Income/Expense, Net Pre-Tax Income 20,497.0 15, 123.0 11,460.0 20.116.0 Provision for Income Tax Net Income 13,643.0 9,862.0 6,670.0 14,881.0 Dividend Per Share 2.00 2.04 2.08 2.12 Tax Rate 30.2678 31.7397 33.4991 24.4333 Basic EPS 4.40 3.29 2.28 5.22 Diluted EPS 4.38 3.21 2.41 5.19 Revenue 523.96B EBITDA 31.97B Analyst Recommendation Net Income 14.88B Return on Capital % 6.58 8/16/2020 Market Cap 375.52B Return on Equity% 22.03 Strong Buy Enterprise Value 424.49B Return on Assets % 6.58 1 Year Price Target 140.00 Net Profit Margin% 2.90 Book Value/Share 24.10 Analysts 34 EPS Estimate 5.02 PEG (Price/Earnings Growth) Ratio 27.95 Shares Outstanding 2.83B Cashflow Estimate Beta 0.26 Last Split Factor (Date) 2:1 (4/20/1999) 20 Forward P/E 26.58 Last Dividend (Ex-Date) 0.54 (12/10/2020) 8 Price/Sales 0.00 Dividend Declaration Date 2/18/2020 0 0 Sell Buy Hold Consensus ostnate data Price/Book Value 5.03 Price/Cash flow 1433 FINANCIAL HEALTH TRADING STATISTICS MANAGEMENT EFFECTIVENESS Industry Food & Drug Retailing Financial Ratios Company Industry LOS Debt/Equity Ratio 0.70 1.21 Current Ratio 0.77 0.98 0.75 0.60 Quick Ratio 0.22 0.64 0445 Leverage Ratio 3.41 3.97 230 Book Value/Share 24.10 1.90 Jan'13 14 15 15 18 19 20 Debt/Equity Ratio Book Value/Share WALMART INC. NYSE: WMT US Markets Closed a Quote Search 132.60A +0.75 After Hours : 133.10 +0.50 +0.38% +0.57% August 14, 2020 7:59 PM EDT. Delayed 15 minutes. Currency In USD #SAVE SUMMARY FINANCIALS ANALYSIS OPTIONS OWNERSHIP COMPANY HISTORY RELATED WALMART INC. revenues grew 1.86 % in FY 2020 as compared to FY 2019 to 523.96B. Net income grew 123.10 % to 14.88B. Operating Income 20.57B Operating Margin 3.93 INCOME STATEMENT BALANCE SHEET CASH FLOW ANNUAL QUARTERLY 595.000 3.15 510.000 2.70 425.000 2.25 340.000 1.80 255.000 (11 1.35 170.000 090 85.00 0 0.00 2017 2018 2019 2020 Revenue Net Income Profit Margin (Right Axis) Values in Millions (Except for per share 2017 2018 2019 2020 items) Period End Date 01/31/2017 01/31/2018 01/31/2019 01/31/2020 Stmt Source Annual Annual Annual Annual Stmt Source Date 01/31/2017 01/31/2018 01/31/2019 01/31/2020 Stmt Update Type Currency Code Total Revenue 485,873.0 500,343.0 514,405.0 523,964.0 Cost of Revenue 361,256.0 373,396.0 385,301.0 394,605.0 Gross Profit 124,617.0 126,947.0 129,104.0 129,359.0 Selling General and Administrative 101,853.0 106,510,0 107.147.0 108,791.0 Research and Development Special Income/Charges -3,136.0 -4,800.0 0.0 Operating Expenses 463,109.0 483,042.0 497,248.0 503,396.0 Operating Income 22,764.0 17,301.0 17,157.0 20,568.0 Net Interest Income Other Income/Expense, Net Pre-Tax Income 20,497.0 15, 123.0 11,460.0 20.116.0 Provision for Income Tax Net Income 13,643.0 9,862.0 6,670.0 14,881.0 Dividend Per Share 2.00 2.04 2.08 2.12 Tax Rate 30.2678 31.7397 33.4991 24.4333 Basic EPS 4.40 3.29 2.28 5.22 Diluted EPS 4.38 3.21 2.41 5.19 Revenue 523.96B EBITDA 31.97B Analyst Recommendation Net Income 14.88B Return on Capital % 6.58 8/16/2020 Market Cap 375.52B Return on Equity% 22.03 Strong Buy Enterprise Value 424.49B Return on Assets % 6.58 1 Year Price Target 140.00 Net Profit Margin% 2.90 Book Value/Share 24.10 Analysts 34 EPS Estimate 5.02 PEG (Price/Earnings Growth) Ratio 27.95 Shares Outstanding 2.83B Cashflow Estimate Beta 0.26 Last Split Factor (Date) 2:1 (4/20/1999) 20 Forward P/E 26.58 Last Dividend (Ex-Date) 0.54 (12/10/2020) 8 Price/Sales 0.00 Dividend Declaration Date 2/18/2020 0 0 Sell Buy Hold Consensus ostnate data Price/Book Value 5.03 Price/Cash flow 1433 FINANCIAL HEALTH TRADING STATISTICS MANAGEMENT EFFECTIVENESS Industry Food & Drug Retailing Financial Ratios Company Industry LOS Debt/Equity Ratio 0.70 1.21 Current Ratio 0.77 0.98 0.75 0.60 Quick Ratio 0.22 0.64 0445 Leverage Ratio 3.41 3.97 230 Book Value/Share 24.10 1.90 Jan'13 14 15 15 18 19 20 Debt/Equity Ratio Book Value/Share