financial information
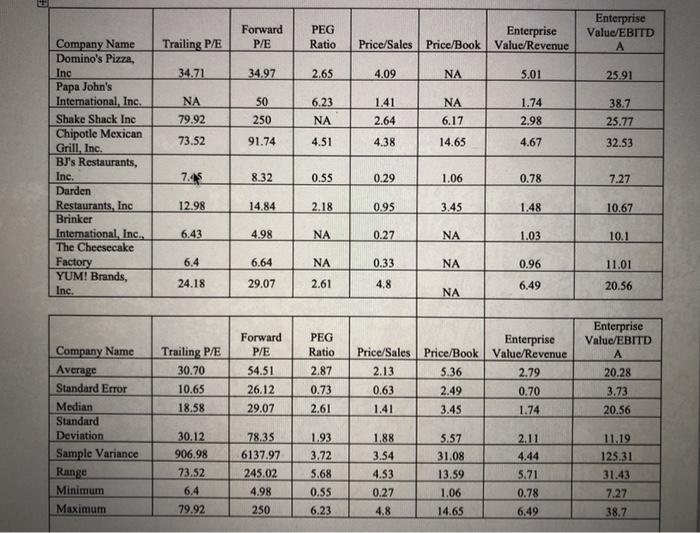
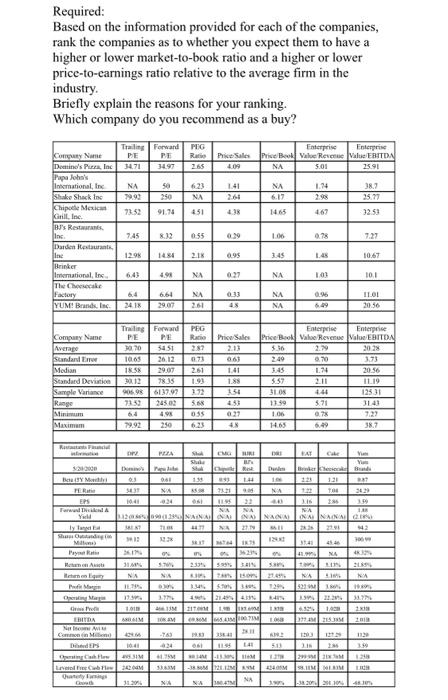
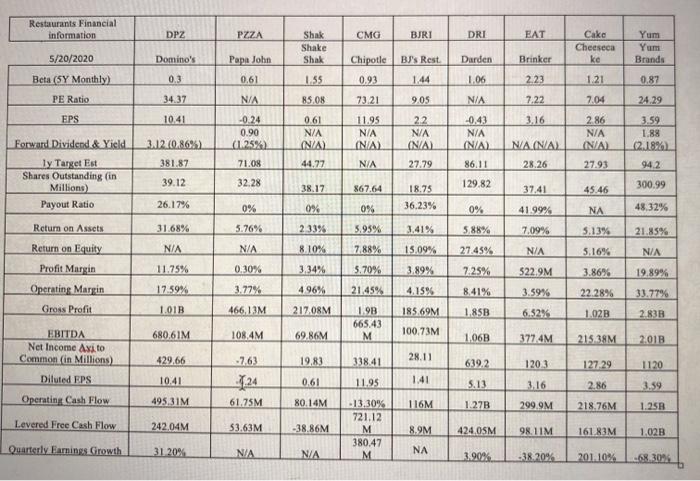
Required: Based on the information provided for each of the companies, rank the companies as to whether you expect them to have a higher or lower market-to-book ratio and a higher or lower price-to-carnings ratio relative to the average firm in the industry Briefly explain the reasons for your ranking. Which company do you recommend as a buy? Dentine's Pura Inc Trailing Forward PE 1471 34.97 PEG Ret Price Sales 2.65 4.09 Enterprise Enterprise Price Bed ValueRece Value EBITDA NA 5.01 25.91 Papa Johas NA 141 38.7 50 250 623 NA NA 6.17 1.94 29 7152 91.74 451 4.38 7.45 8.12 055 0.99 100 0? International, Inc ShakeShack Inc Chipole Mexico kanill inc. BI's Restaurants Inc Darden Restaurants ine Brinker Immational Inc The Cheesecake Factory YUM! Brands 12.95 1434 21 0.95 3:45 10,67 4,9 NA 027 NA TO 101 NA 6.64 29.07 0333 45 0.96 NA NA ILOI 20.56 2418 2.61 Kompany Name PEG Ratio 287 671 Standard Median Standard Deviation Sample Variance Range Trailing Forward PE PE 0.70 51 16 26.12 INS 29.07 301 7835 0696 613707 245.00 60 4.95 79.92 250 Enterprise Enterprise Price Book Value Revenue Value EBITDA 5.36 2023 2:49 0.70 373 L24 20.56 5.57 2.11 1119 310S 12531 1139 5.71 3143 0.7 Ho 6.99 Price Sales 2.13 063 1.41 1.85 154 53 0.37 48 1.93 SM 55 7.23 Maximum 6.23 Recuci SU BY M PER EPS Forward Yw By BURI Shule Star 158 NA 2321 NA 12 TO 11922 SANA NA 2018.MAINA NA NA NA NA NANA ENT BUT 13 Mi BIN NA NA I. 1:01 AM M EBITDA NOMIA CM DEP 4. NA 237 San 2018 MANA 15.03.12 5231 21.923 19222.3.7 11 mm 10 2x MIMI 20 3341 123 1 13 OS 141 3. M -3812 OM SANIRIM NA -320 -763 SIM 1. SAM Liebe ty 31.2018 NA Forward P/E PEG Ratio Trailing P/E Enterprise Value/EBITD A Enterprise Price/Book Value/Revenue Price/Sales 34.71 34.97 2.65 4.09 NA 5.01 25.91 38.7 NA 79.92 50 250 6.23 NA 1.41 2.64 NA 6.17 1.74 2.98 25.77 73.52 91.74 4.51 4.38 14.65 4.67 32.53 Company Name Domino's Pizza, Inc Papa John's International, Inc. Shake Shack Inc Chipotle Mexican Grill, Inc. BJ's Restaurants, Inc. Darden Restaurants, Inc Brinker International, Inc. The Cheesecake Factory YUM! Brands, Inc. 7.45 8.32 0.55 0.29 1.06 0.78 7.27 12.98 14.84 2.18 0.95 3.45 1.48 10.67 6.43 4.98 NA 0.27 NA 1.03 10.1 6.4 6.64 NA 0.33 NA 0.96 11.01 24.18 29.07 2.61 4.8 6.49 NA 20.56 Trailing P/E 30.70 10.65 18.58 Forward P/E 54.51 26.12 29.07 PEG Ratio 2.87 0.73 2.61 Enterprise Price/Sales Price/Book Value/Revenue 2.13 5.36 2.79 0.63 2.49 0.70 1.41 3.45 1.74 Enterprise Value/EBITD A 20.28 3.73 20.56 Company Name Average Standard Error Median Standard Deviation Sample Variance Range Minimum Maximum 1.88 3.54 30.12 906.98 73.52 6.4 79.92 78.35 6137.97 245.02 4.98 250 1.93 3.72 5.68 0.55 6.23 4.53 0.27 4.8 5.57 31.08 13.59 1.06 14.65 2.11 4.44 5.71 0.78 6.49 11.19 125.31 31.43 7.27 38.7 Restaurants Financial information DPZ PZZA CMG BJRI DRI EAT Shak Shake Shak Cake Cheeseca ke Yum Yum Brands Domino's BU's Rest Darden Brinker 5/20/2020 Beta (5Y Monthly) Papa John 0.61 Chipotle 0.93 0.3 1.55 1.44 1.06 2.23 1.21 0.87 PE Ratio 34.37 N/A 85.08 9.05 N/A 7.22 7.04 24.29 EPS 10.41 -0.24 0.90 (1.25%) 3.16 7321 11.95 N/A (N/A) 0.61 N/A N/A) 22 NA (N/A) 27.79 -0.43 N/A (N/A 2 86 N/A (N/A) 3.59 1.88 (2.18%) 3.120.86%) 381.87 NA (NA) 71.08 44.77 N/A 86.11 28.26 27.93 942 39.12 32.28 129.82 38.17 867.64 300.99 37.41 18.75 36.23% 26.17% 45.46 NA 0% 0% 0% 0% 41.99% 48.32% Forward Dividend & Yield ly Target Est Shares Outstanding in Millions Payout Ratio Return on Assets Return on Equity Profit Margin Operating Margin Gross Profit 31.68% 5.76% 2 3396 3.41% 588% 7.09% 5.13% 21.85% 5.95% 7.88% N/A N/A 8.10% 27.45% N/A 5.16% N/A 15.09% 3.89% 11.75% 0.30% 3.34% 5.70% 7.25% $22.9M 3.86% 19.89% 17.59% 21.45% 4.15% 8.41% 3.59% 22.28% 3.77% 466,13M 496% 217.08M 1.013 185.69M 1.85B 6.52% 1.02B 2.838 1.98 665.43 M 100.73M 680.61M 108,4M 69.86M 1.06B 377.4M 215 38M 2013 EBITDA Net Income Axito Common (in Millions) Diluted EPS 429.66 19,83 338.41 28.11 1203 127.29 -763 124 61.75M 6392 5.13 10.41 1120 3.59 0.61 11.95 3.16 2.86 Operating Cash Flow 495 31M 80.14M 116M 1.27B 299.9M 218.76M 1.250 Levered Free Cash Flow 242.04M 53.63M -38.86M -13.30% 721.12 M 380.47 M 8.9M 424.OSM 98.11M 161.83M 1.02B Quarterly Earnings Growth 31 20% N/A NA N/A 3.90% -38,20% 201.10% -68.30% Required: Based on the information provided for each of the companies, rank the companies as to whether you expect them to have a higher or lower market-to-book ratio and a higher or lower price-to-carnings ratio relative to the average firm in the industry Briefly explain the reasons for your ranking. Which company do you recommend as a buy? Dentine's Pura Inc Trailing Forward PE 1471 34.97 PEG Ret Price Sales 2.65 4.09 Enterprise Enterprise Price Bed ValueRece Value EBITDA NA 5.01 25.91 Papa Johas NA 141 38.7 50 250 623 NA NA 6.17 1.94 29 7152 91.74 451 4.38 7.45 8.12 055 0.99 100 0? International, Inc ShakeShack Inc Chipole Mexico kanill inc. BI's Restaurants Inc Darden Restaurants ine Brinker Immational Inc The Cheesecake Factory YUM! Brands 12.95 1434 21 0.95 3:45 10,67 4,9 NA 027 NA TO 101 NA 6.64 29.07 0333 45 0.96 NA NA ILOI 20.56 2418 2.61 Kompany Name PEG Ratio 287 671 Standard Median Standard Deviation Sample Variance Range Trailing Forward PE PE 0.70 51 16 26.12 INS 29.07 301 7835 0696 613707 245.00 60 4.95 79.92 250 Enterprise Enterprise Price Book Value Revenue Value EBITDA 5.36 2023 2:49 0.70 373 L24 20.56 5.57 2.11 1119 310S 12531 1139 5.71 3143 0.7 Ho 6.99 Price Sales 2.13 063 1.41 1.85 154 53 0.37 48 1.93 SM 55 7.23 Maximum 6.23 Recuci SU BY M PER EPS Forward Yw By BURI Shule Star 158 NA 2321 NA 12 TO 11922 SANA NA 2018.MAINA NA NA NA NA NANA ENT BUT 13 Mi BIN NA NA I. 1:01 AM M EBITDA NOMIA CM DEP 4. NA 237 San 2018 MANA 15.03.12 5231 21.923 19222.3.7 11 mm 10 2x MIMI 20 3341 123 1 13 OS 141 3. M -3812 OM SANIRIM NA -320 -763 SIM 1. SAM Liebe ty 31.2018 NA Forward P/E PEG Ratio Trailing P/E Enterprise Value/EBITD A Enterprise Price/Book Value/Revenue Price/Sales 34.71 34.97 2.65 4.09 NA 5.01 25.91 38.7 NA 79.92 50 250 6.23 NA 1.41 2.64 NA 6.17 1.74 2.98 25.77 73.52 91.74 4.51 4.38 14.65 4.67 32.53 Company Name Domino's Pizza, Inc Papa John's International, Inc. Shake Shack Inc Chipotle Mexican Grill, Inc. BJ's Restaurants, Inc. Darden Restaurants, Inc Brinker International, Inc. The Cheesecake Factory YUM! Brands, Inc. 7.45 8.32 0.55 0.29 1.06 0.78 7.27 12.98 14.84 2.18 0.95 3.45 1.48 10.67 6.43 4.98 NA 0.27 NA 1.03 10.1 6.4 6.64 NA 0.33 NA 0.96 11.01 24.18 29.07 2.61 4.8 6.49 NA 20.56 Trailing P/E 30.70 10.65 18.58 Forward P/E 54.51 26.12 29.07 PEG Ratio 2.87 0.73 2.61 Enterprise Price/Sales Price/Book Value/Revenue 2.13 5.36 2.79 0.63 2.49 0.70 1.41 3.45 1.74 Enterprise Value/EBITD A 20.28 3.73 20.56 Company Name Average Standard Error Median Standard Deviation Sample Variance Range Minimum Maximum 1.88 3.54 30.12 906.98 73.52 6.4 79.92 78.35 6137.97 245.02 4.98 250 1.93 3.72 5.68 0.55 6.23 4.53 0.27 4.8 5.57 31.08 13.59 1.06 14.65 2.11 4.44 5.71 0.78 6.49 11.19 125.31 31.43 7.27 38.7 Restaurants Financial information DPZ PZZA CMG BJRI DRI EAT Shak Shake Shak Cake Cheeseca ke Yum Yum Brands Domino's BU's Rest Darden Brinker 5/20/2020 Beta (5Y Monthly) Papa John 0.61 Chipotle 0.93 0.3 1.55 1.44 1.06 2.23 1.21 0.87 PE Ratio 34.37 N/A 85.08 9.05 N/A 7.22 7.04 24.29 EPS 10.41 -0.24 0.90 (1.25%) 3.16 7321 11.95 N/A (N/A) 0.61 N/A N/A) 22 NA (N/A) 27.79 -0.43 N/A (N/A 2 86 N/A (N/A) 3.59 1.88 (2.18%) 3.120.86%) 381.87 NA (NA) 71.08 44.77 N/A 86.11 28.26 27.93 942 39.12 32.28 129.82 38.17 867.64 300.99 37.41 18.75 36.23% 26.17% 45.46 NA 0% 0% 0% 0% 41.99% 48.32% Forward Dividend & Yield ly Target Est Shares Outstanding in Millions Payout Ratio Return on Assets Return on Equity Profit Margin Operating Margin Gross Profit 31.68% 5.76% 2 3396 3.41% 588% 7.09% 5.13% 21.85% 5.95% 7.88% N/A N/A 8.10% 27.45% N/A 5.16% N/A 15.09% 3.89% 11.75% 0.30% 3.34% 5.70% 7.25% $22.9M 3.86% 19.89% 17.59% 21.45% 4.15% 8.41% 3.59% 22.28% 3.77% 466,13M 496% 217.08M 1.013 185.69M 1.85B 6.52% 1.02B 2.838 1.98 665.43 M 100.73M 680.61M 108,4M 69.86M 1.06B 377.4M 215 38M 2013 EBITDA Net Income Axito Common (in Millions) Diluted EPS 429.66 19,83 338.41 28.11 1203 127.29 -763 124 61.75M 6392 5.13 10.41 1120 3.59 0.61 11.95 3.16 2.86 Operating Cash Flow 495 31M 80.14M 116M 1.27B 299.9M 218.76M 1.250 Levered Free Cash Flow 242.04M 53.63M -38.86M -13.30% 721.12 M 380.47 M 8.9M 424.OSM 98.11M 161.83M 1.02B Quarterly Earnings Growth 31 20% N/A NA N/A 3.90% -38,20% 201.10% -68.30%