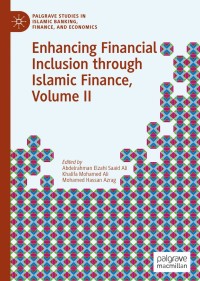
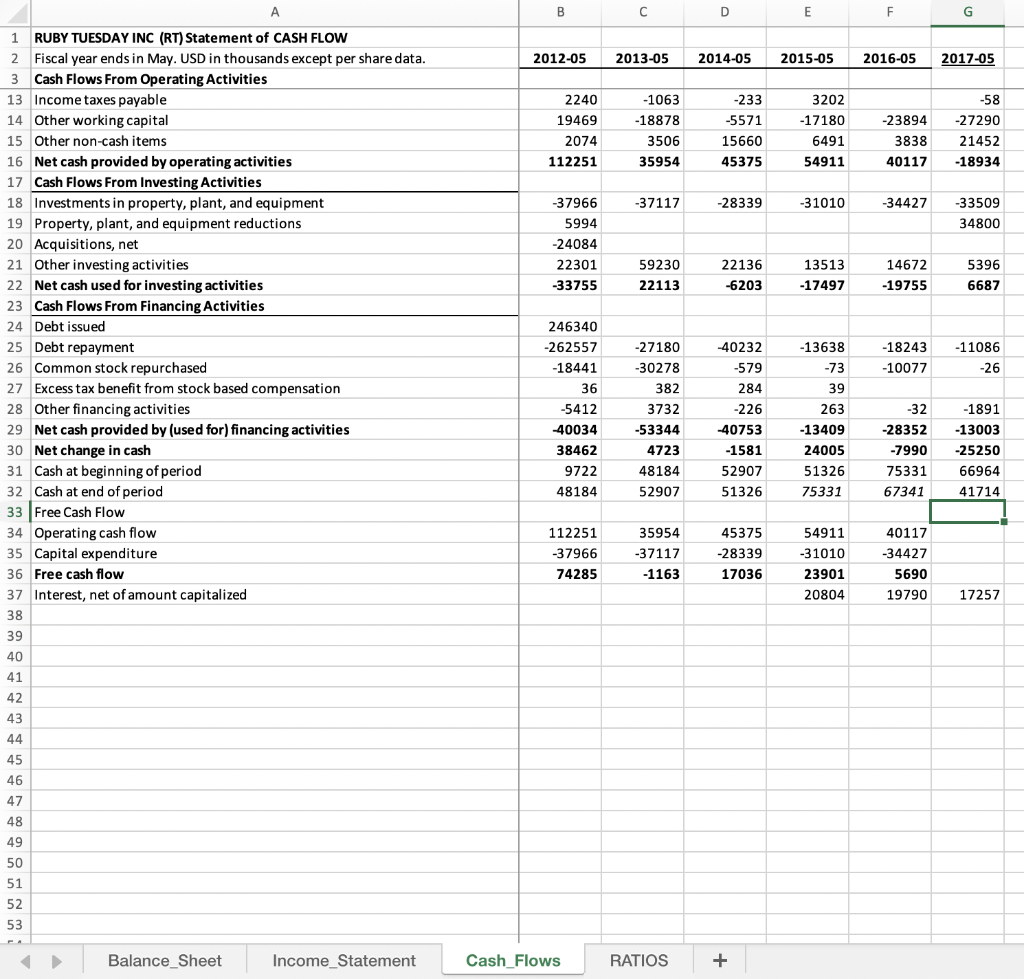
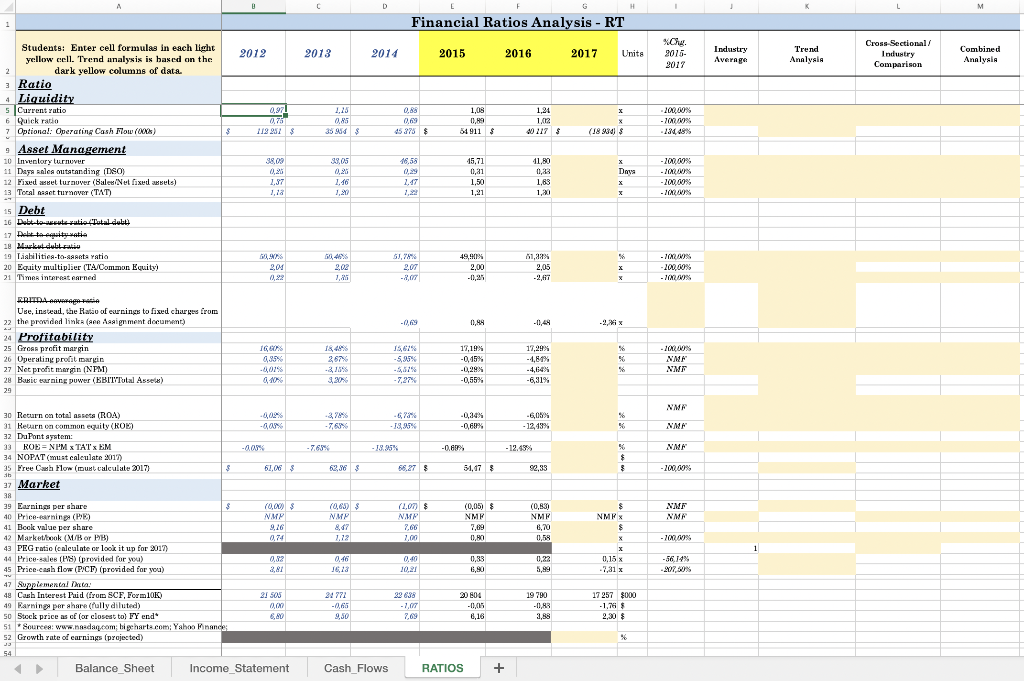
Financial Ratio Analysis
You must fill in the column(s) in the RT worksheet for the 2017 data.
Excel file, partly done, to use for calculating your financial ratios and for entering industry average ratio values.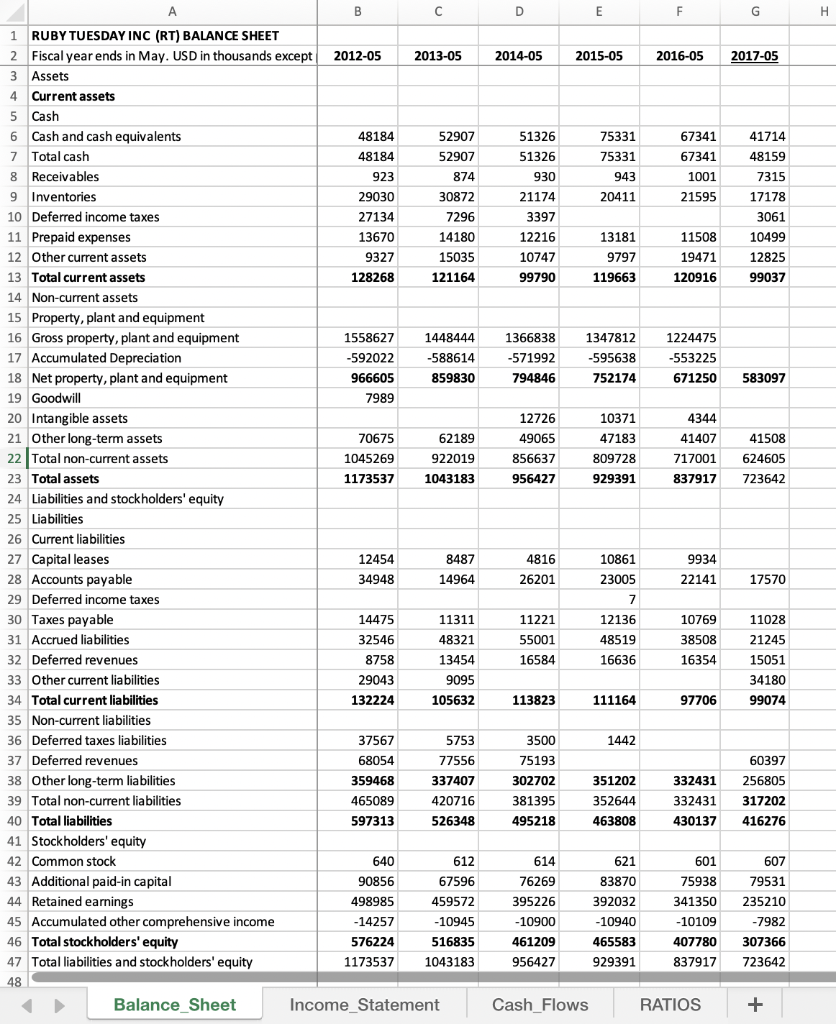
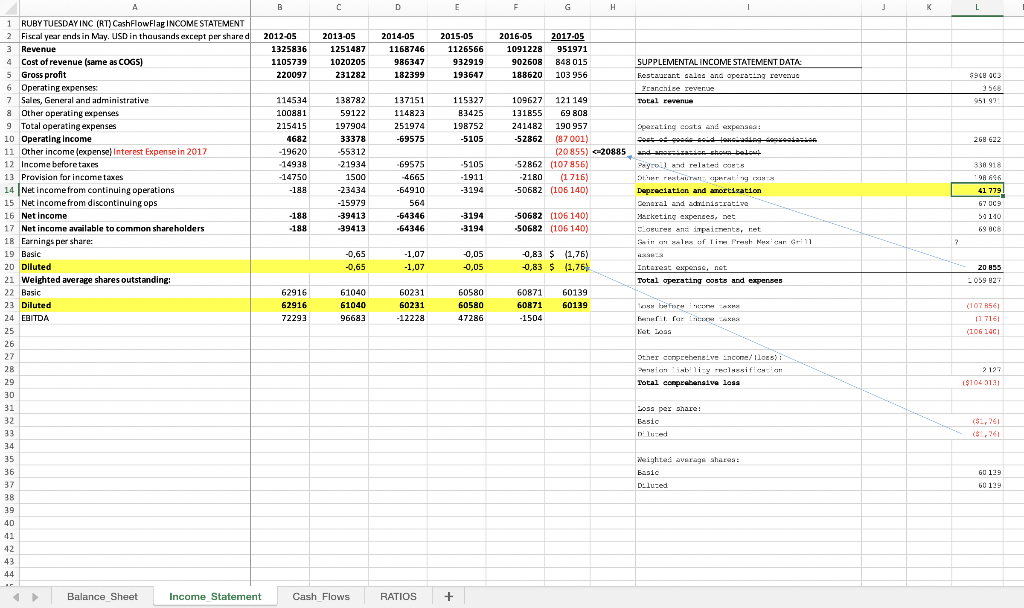
D E F . 2014-05 2015-05 2016-05 2017-05 51326 51326 75331 75331 67341 67341 1001 21595 930 943 20411 21174 3397 12216 10747 99790 41714 48159 7315 17178 3061 10499 12825 99037 13181 9797 119663 11508 19471 120916 1366838 -571992 794846 1347812 -595638 752174 1224475 -553225 671250 583097 12726 49065 856637 10371 47183 4344 41407 41508 624605 809728 717001 956427 929391 837917 723642 A B 1 RUBY TUESDAY INC (RT) BALANCE SHEET 2 Fiscal year ends in May. USD in thousands except 2012-05 2013-05 3 Assets 4 Current assets 5 Cash 6 Cash and cash equivalents 48184 52907 7 Total cash 48184 52907 8 Receivables 923 874 9 Inventories 29030 30872 10 Deferred income taxes 27134 7296 11 Prepaid expenses 13670 14180 12 Other current assets 9327 15035 13 Total current assets 128268 121164 14 Non-current assets 15 Property, plant and equipment 16 Gross property, plant and equipment 1558627 1448444 17 Accumulated Depreciation -592022 -588614 18 Net property, plant and equipment 966605 859830 19 Goodwill 7989 20 Intangible assets 21 Other long-term assets 70675 62189 22 Total non-current assets 1045269 922019 23 Total assets 1173537 1043183 24 Liabilities and stockholders' equity 25 Liabilities 26 Current liabilities 27 Capital leases 12454 8487 28 Accounts payable 34948 14964 29 Deferred income taxes 30 Taxes payable 14475 11311 31 Accrued liabilities 32546 48321 32 Deferred revenues 8758 13454 33 Other current liabilities 29043 9095 34 Total current liabilities 132224 105632 35 Non-current liabilities 36 Deferred taxes liabilities 37567 5753 37 Deferred revenues 68054 77556 38 Other long-term liabilities 359468 337407 39 Total non-current liabilities 465089 420716 40 Total liabilities 597313 526348 41 Stockholders' equity 42 Common stock 640 612 43 Additional paid-in capital 90856 67596 44 Retained earnings 498985 459572 45 Accumulated other comprehensive income -14257 -10945 46 Total stockholders' equity 576224 516835 47 Total liabilities and stockholders' equity 1173537 1043183 48 Balance Sheet Income_Statement 4816 26201 10861 23005 9934 22141 17570 11221 7 12136 48519 11028 55001 16584 10769 38508 16354 16636 21245 15051 34180 113823 111164 97706 99074 1442 3500 75193 302702 381395 351202 352644 463808 332431 332431 430137 60397 256805 317202 416276 495218 601 75938 607 79531 235210 614 76269 395226 -10900 461209 956427 621 83870 392032 -10940 465583 929391 341350 -10109 407780 837917 -7982 307366 723642 Cash Flows RATIOS + B C D E F G H J K 2012-05 1325836 1105739 220097 2013-05 1251487 1020205 231282 2014-05 1168746 986347 182399 2015-05 1126566 932919 193647 2016-05 1091228 902608 188620 2017-05 951971 848 015 103 956 $90 C3 SUPPLEMENTAL INCOME STATEMENT DATA Restaurant sales and operating reverde Erarchize revenue Total revenue 9568 95199 137151 114823 251974 -69575 115327 B3425 198752 -5105 269 622 114534 100881 215415 4682 -19620 -14938 -14750 -188 138782 59122 197904 33378 -55312 21934 1500 -23434 -15979 -39413 -39413 109627 121 149 131855 69 808 241482 190 957 -52862 (87001) (20855) 20885 -52862 (107856) -2180 (1 716) -50682 (106140) -5105 -1911 -3194 338 918 DA 696 Operating coats and expensa: aa und der shows below Payroll and rentals DIT HETALIA Depreciation and amortization Seneral and actinis rative Marketing expenses, na Boccer and impairments, ret Larry sin chels of Tir Preth Numer G11 -69575 -4665 -64910 564 -64346 -64346 41 779 67 UC 9 -188 -188 -3194 -3194 -50682 (106 140) -50682 (106 140) 50140 69 08 ? -0,65 -0.65 -1,07 -1,07 -0,05 -0,05 -0,83 $ (1.76) -0,83 $ (1,76) Interest expec, net Total operating costs and expenses 20 855 2059 827 1 RUBY TUESDAY INC (RT) Cash FlowFlag INCOME STATEMENT 2 Fiscal year ends in May. USD in thousands except per shared 3 Revenue Cost of revenue (same as COGS) 5 Gross profit 6 Operating expenses 7 Sales, General and administrative 8 Other operating expenses 9 Total operating expenses 10 Operating Income 11 Other income (expense Interest Expense in 2017 12 Income before takes 13 Provision for income taxes 14 Net income from continuing operations 15 Net income from discontinuing ops 16 Net Income 17 Net income available to common shareholders 18 Earnings per share: : 19 Basic 20 Diluted 21 Weighted average shares outstanding: 22 Basic 23 Diluted 24 EBITDA 25 26 27 28 29 30 31 32 33 34 35 36 37 38 39 40 41 42 43 44 62916 62916 72293 61040 61040 96683 60231 60231 -12228 60580 60580 47286 60871 60871 -1504 60139 60139 fra TOM *AX far CRM Ket 03s (10756 11 716 (106 1401 Other comprehensive Income Iles) Pension lieblicy reclusif: cha Total comprehensive los 2127 ($1043131 Loss per share Basic Dilute ($1,761 Weighted average aharaa: Easic Dulused 60 129 60119 Balance Sheet Income Statement Cash Flows RATIOS + A B C D E 2012-05 2013-05 2014-05 2015-05 2016-05 2017-05 -58 2240 19469 2074 112251 -1063 -18878 3506 35954 -233 -5571 15660 45375 3202 -17180 6491 54911 -23894 3838 40117 -27290 21452 -18934 -37117 -28339 -31010 -34427 -33509 34800 -37966 5994 -24084 22301 -33755 59230 22113 22136 -6203 13513 -17497 14672 -19755 5396 6687 1 RUBY TUESDAY INC (RT) Statement of CASH FLOW 2 Fiscal year ends in May. USD in thousands except per share data. 3 Cash Flows From Operating Activities 13 Income taxes payable 14 Other working capital 15 Other non-cash items 16 Net cash provided by operating activities 17 Cash Flows From Investing Activities 18 Investments in property, plant, and equipment 19 Property, plant, and equipment reductions 20 Acquisitions, net 21 Other investing activities 22 Net cash used for investing activities 23 Cash Flows From Financing Activities 24 Debt issued 25 Debt repayment 26 Common stock repurchased 27 Excess tax benefit from stock based compensation 28 Other financing activities 29 Net cash provided by (used for) financing activities 30 Net change in cash 31 Cash at beginning of period 32 Cash at end of period 33 Free Cash Flow 34 Operating cash flow 35 Capital expenditure 36 Free cash flow 37 Interest, net of amount capitalized 38 39 -18243 -10077 -11086 -26 246340 -262557 -18441 36 -5412 -40034 38462 9722 48184 -27180 -30278 382 3732 -53344 4723 48184 52907 -40232 -579 284 -226 -40753 -1581 52907 51326 -13638 -73 39 263 -13409 24005 51326 -32 -28352 -7990 75331 -1891 -13003 -25250 66964 41714 75331 67341 112251 -37966 74285 35954 -37117 -1163 45375 -28339 17036 54911 -31010 23901 20804 40117 -34427 5690 19790 17257 40 41 42 43 44 45 46 47 48 49 50 51 52 53 Balance_Sheet Income_Statement Cash_Flows RATIOS + + D 1 Financial Ratios Analysis - RT 2012 2013 2014 2015 2016 2017 Units Che. 2016- 2017 Industry Average Trend Analysis Cross Sectional / Industry Comparison Combined Analysis 0,97 1.15 0,85 35 954 0.88 0,69 45375$ 1,08 0.89 54911 8 1,21 1.12 40217 5 200,00% - 2000 134,48% X (18 990 $ $ 119 252 % Students: Enter cell formulas in each light yellow cell. Trend analysis is based on the 2 dark yellow columns of data Ratio 4 Liquidity 5 Current ratio 6 Quick ratio 7 Optional: Operating Cash Mow (X) 9 Asset Management 10 Inventory turnover 11 Days les cutatanding DSO 12 Fixed asset turnuver (Sales Net fixed assets) 13 Total act turnover (TAT) 15 Debt 16 Debt-to-weute ratio (Doudou) 17 Debt tocosity atie 0,26 2.37 39,05 0,20 1.16 16,58 0,29 1.47 15,71 0,31 1,50 1,21 11,80 0.23 1.83 1,200 X Days X x - 200.00% -20% -2000 -2011 - 19 Taabilities to staratia 20 Equity multiplier (TA/Common Equity 21 MAR in earned 69.97% 2.04 (1,22 69,466 2.03 1,25 51,79% 2.07 -2,07 49,90% 2,00 -11,25 11,38% 2,05 -2,47 X X - 2020 -200,00% - 1012/S -0,69 0,89 -0,44 -2,1 LAIDA ARAW Use, instead, the Ratio of earrings to fixed charges from 22 the prowided link asignment document) 24 Profitability 25 Gross profit margin 26 Operating profit margin 27 Net profit margin (NPM) 28 Basiewning puwer (EBI'Ivrutal Assel) 29 % IG 4.355 -2015 -5,95% 17,19% -0,05% -0,28% -0,55% 17,29% -1,81% -4,64% -6,31% -202% NMF NMR -2,18% 42 46 -7,27% NMR -3.79 -00 -73 - 19,95% % -0,24% -0,69% -6,05% - 12,43% NMF -0.62% - 12.19% NMN $ 3 61,083 62.36 $ 51,17 % 92,33 -200,00% NMF NMN 30 Return on total assets (ROA) 31 Return on common equity (ROE) 32 DuPont system: 33 F0E = NPM x TAT x EM 34 NOPAT (must calculate 2017) 25 Free Cash Flow (Dust calculate 2017) $ ih 37 Market 38 39 Earnings per share $ 40 Price-cerning (PE) 41 Book value per share 42 Market book (M/B or 179) 43 PEG ratio (calculate ce look it up for 2017) 44 Price-sales (108) provided for you) 45 Price cash flow (PCT) (provided for you) 47 Supplementalita: 48 Cash Interest Paid (from SCF, Form10) 49 Rarning per share (fully diluted) 50 Stock price as of (or closest to) FY end 51 "Source: www.nada.com bige harte.com: Yahoo Finance 52 Growth rate of earnings (projected) (0,000 $ NMN 9,26 0.74 (0.63) 3 NMP 8.67 2.12 (2.00 $ NMN 7.66 7.00 (0,05) $ NMF 7.69 0.80 (0,83) NMF 6,70 0,58 $ NMP $ X x 0,15 x -7,31 x - 2009 1 0.40 0,82 3,81 0.46 16,18 0.83 6,90 0,22 5.99 -5614% 227.2% 21 500 0,07 6.80 34 772 -0,65 9.50 22 638 -7.07 7.69 20 804 -0.005 8,16 19 790 -11,83 3,88 17 257 8000 -1,76 2,308 23 54 Balance Sheet Income_Statement Cash_Flows RATIOS + D E F . 2014-05 2015-05 2016-05 2017-05 51326 51326 75331 75331 67341 67341 1001 21595 930 943 20411 21174 3397 12216 10747 99790 41714 48159 7315 17178 3061 10499 12825 99037 13181 9797 119663 11508 19471 120916 1366838 -571992 794846 1347812 -595638 752174 1224475 -553225 671250 583097 12726 49065 856637 10371 47183 4344 41407 41508 624605 809728 717001 956427 929391 837917 723642 A B 1 RUBY TUESDAY INC (RT) BALANCE SHEET 2 Fiscal year ends in May. USD in thousands except 2012-05 2013-05 3 Assets 4 Current assets 5 Cash 6 Cash and cash equivalents 48184 52907 7 Total cash 48184 52907 8 Receivables 923 874 9 Inventories 29030 30872 10 Deferred income taxes 27134 7296 11 Prepaid expenses 13670 14180 12 Other current assets 9327 15035 13 Total current assets 128268 121164 14 Non-current assets 15 Property, plant and equipment 16 Gross property, plant and equipment 1558627 1448444 17 Accumulated Depreciation -592022 -588614 18 Net property, plant and equipment 966605 859830 19 Goodwill 7989 20 Intangible assets 21 Other long-term assets 70675 62189 22 Total non-current assets 1045269 922019 23 Total assets 1173537 1043183 24 Liabilities and stockholders' equity 25 Liabilities 26 Current liabilities 27 Capital leases 12454 8487 28 Accounts payable 34948 14964 29 Deferred income taxes 30 Taxes payable 14475 11311 31 Accrued liabilities 32546 48321 32 Deferred revenues 8758 13454 33 Other current liabilities 29043 9095 34 Total current liabilities 132224 105632 35 Non-current liabilities 36 Deferred taxes liabilities 37567 5753 37 Deferred revenues 68054 77556 38 Other long-term liabilities 359468 337407 39 Total non-current liabilities 465089 420716 40 Total liabilities 597313 526348 41 Stockholders' equity 42 Common stock 640 612 43 Additional paid-in capital 90856 67596 44 Retained earnings 498985 459572 45 Accumulated other comprehensive income -14257 -10945 46 Total stockholders' equity 576224 516835 47 Total liabilities and stockholders' equity 1173537 1043183 48 Balance Sheet Income_Statement 4816 26201 10861 23005 9934 22141 17570 11221 7 12136 48519 11028 55001 16584 10769 38508 16354 16636 21245 15051 34180 113823 111164 97706 99074 1442 3500 75193 302702 381395 351202 352644 463808 332431 332431 430137 60397 256805 317202 416276 495218 601 75938 607 79531 235210 614 76269 395226 -10900 461209 956427 621 83870 392032 -10940 465583 929391 341350 -10109 407780 837917 -7982 307366 723642 Cash Flows RATIOS + B C D E F G H J K 2012-05 1325836 1105739 220097 2013-05 1251487 1020205 231282 2014-05 1168746 986347 182399 2015-05 1126566 932919 193647 2016-05 1091228 902608 188620 2017-05 951971 848 015 103 956 $90 C3 SUPPLEMENTAL INCOME STATEMENT DATA Restaurant sales and operating reverde Erarchize revenue Total revenue 9568 95199 137151 114823 251974 -69575 115327 B3425 198752 -5105 269 622 114534 100881 215415 4682 -19620 -14938 -14750 -188 138782 59122 197904 33378 -55312 21934 1500 -23434 -15979 -39413 -39413 109627 121 149 131855 69 808 241482 190 957 -52862 (87001) (20855) 20885 -52862 (107856) -2180 (1 716) -50682 (106140) -5105 -1911 -3194 338 918 DA 696 Operating coats and expensa: aa und der shows below Payroll and rentals DIT HETALIA Depreciation and amortization Seneral and actinis rative Marketing expenses, na Boccer and impairments, ret Larry sin chels of Tir Preth Numer G11 -69575 -4665 -64910 564 -64346 -64346 41 779 67 UC 9 -188 -188 -3194 -3194 -50682 (106 140) -50682 (106 140) 50140 69 08 ? -0,65 -0.65 -1,07 -1,07 -0,05 -0,05 -0,83 $ (1.76) -0,83 $ (1,76) Interest expec, net Total operating costs and expenses 20 855 2059 827 1 RUBY TUESDAY INC (RT) Cash FlowFlag INCOME STATEMENT 2 Fiscal year ends in May. USD in thousands except per shared 3 Revenue Cost of revenue (same as COGS) 5 Gross profit 6 Operating expenses 7 Sales, General and administrative 8 Other operating expenses 9 Total operating expenses 10 Operating Income 11 Other income (expense Interest Expense in 2017 12 Income before takes 13 Provision for income taxes 14 Net income from continuing operations 15 Net income from discontinuing ops 16 Net Income 17 Net income available to common shareholders 18 Earnings per share: : 19 Basic 20 Diluted 21 Weighted average shares outstanding: 22 Basic 23 Diluted 24 EBITDA 25 26 27 28 29 30 31 32 33 34 35 36 37 38 39 40 41 42 43 44 62916 62916 72293 61040 61040 96683 60231 60231 -12228 60580 60580 47286 60871 60871 -1504 60139 60139 fra TOM *AX far CRM Ket 03s (10756 11 716 (106 1401 Other comprehensive Income Iles) Pension lieblicy reclusif: cha Total comprehensive los 2127 ($1043131 Loss per share Basic Dilute ($1,761 Weighted average aharaa: Easic Dulused 60 129 60119 Balance Sheet Income Statement Cash Flows RATIOS + A B C D E 2012-05 2013-05 2014-05 2015-05 2016-05 2017-05 -58 2240 19469 2074 112251 -1063 -18878 3506 35954 -233 -5571 15660 45375 3202 -17180 6491 54911 -23894 3838 40117 -27290 21452 -18934 -37117 -28339 -31010 -34427 -33509 34800 -37966 5994 -24084 22301 -33755 59230 22113 22136 -6203 13513 -17497 14672 -19755 5396 6687 1 RUBY TUESDAY INC (RT) Statement of CASH FLOW 2 Fiscal year ends in May. USD in thousands except per share data. 3 Cash Flows From Operating Activities 13 Income taxes payable 14 Other working capital 15 Other non-cash items 16 Net cash provided by operating activities 17 Cash Flows From Investing Activities 18 Investments in property, plant, and equipment 19 Property, plant, and equipment reductions 20 Acquisitions, net 21 Other investing activities 22 Net cash used for investing activities 23 Cash Flows From Financing Activities 24 Debt issued 25 Debt repayment 26 Common stock repurchased 27 Excess tax benefit from stock based compensation 28 Other financing activities 29 Net cash provided by (used for) financing activities 30 Net change in cash 31 Cash at beginning of period 32 Cash at end of period 33 Free Cash Flow 34 Operating cash flow 35 Capital expenditure 36 Free cash flow 37 Interest, net of amount capitalized 38 39 -18243 -10077 -11086 -26 246340 -262557 -18441 36 -5412 -40034 38462 9722 48184 -27180 -30278 382 3732 -53344 4723 48184 52907 -40232 -579 284 -226 -40753 -1581 52907 51326 -13638 -73 39 263 -13409 24005 51326 -32 -28352 -7990 75331 -1891 -13003 -25250 66964 41714 75331 67341 112251 -37966 74285 35954 -37117 -1163 45375 -28339 17036 54911 -31010 23901 20804 40117 -34427 5690 19790 17257 40 41 42 43 44 45 46 47 48 49 50 51 52 53 Balance_Sheet Income_Statement Cash_Flows RATIOS + + D 1 Financial Ratios Analysis - RT 2012 2013 2014 2015 2016 2017 Units Che. 2016- 2017 Industry Average Trend Analysis Cross Sectional / Industry Comparison Combined Analysis 0,97 1.15 0,85 35 954 0.88 0,69 45375$ 1,08 0.89 54911 8 1,21 1.12 40217 5 200,00% - 2000 134,48% X (18 990 $ $ 119 252 % Students: Enter cell formulas in each light yellow cell. Trend analysis is based on the 2 dark yellow columns of data Ratio 4 Liquidity 5 Current ratio 6 Quick ratio 7 Optional: Operating Cash Mow (X) 9 Asset Management 10 Inventory turnover 11 Days les cutatanding DSO 12 Fixed asset turnuver (Sales Net fixed assets) 13 Total act turnover (TAT) 15 Debt 16 Debt-to-weute ratio (Doudou) 17 Debt tocosity atie 0,26 2.37 39,05 0,20 1.16 16,58 0,29 1.47 15,71 0,31 1,50 1,21 11,80 0.23 1.83 1,200 X Days X x - 200.00% -20% -2000 -2011 - 19 Taabilities to staratia 20 Equity multiplier (TA/Common Equity 21 MAR in earned 69.97% 2.04 (1,22 69,466 2.03 1,25 51,79% 2.07 -2,07 49,90% 2,00 -11,25 11,38% 2,05 -2,47 X X - 2020 -200,00% - 1012/S -0,69 0,89 -0,44 -2,1 LAIDA ARAW Use, instead, the Ratio of earrings to fixed charges from 22 the prowided link asignment document) 24 Profitability 25 Gross profit margin 26 Operating profit margin 27 Net profit margin (NPM) 28 Basiewning puwer (EBI'Ivrutal Assel) 29 % IG 4.355 -2015 -5,95% 17,19% -0,05% -0,28% -0,55% 17,29% -1,81% -4,64% -6,31% -202% NMF NMR -2,18% 42 46 -7,27% NMR -3.79 -00 -73 - 19,95% % -0,24% -0,69% -6,05% - 12,43% NMF -0.62% - 12.19% NMN $ 3 61,083 62.36 $ 51,17 % 92,33 -200,00% NMF NMN 30 Return on total assets (ROA) 31 Return on common equity (ROE) 32 DuPont system: 33 F0E = NPM x TAT x EM 34 NOPAT (must calculate 2017) 25 Free Cash Flow (Dust calculate 2017) $ ih 37 Market 38 39 Earnings per share $ 40 Price-cerning (PE) 41 Book value per share 42 Market book (M/B or 179) 43 PEG ratio (calculate ce look it up for 2017) 44 Price-sales (108) provided for you) 45 Price cash flow (PCT) (provided for you) 47 Supplementalita: 48 Cash Interest Paid (from SCF, Form10) 49 Rarning per share (fully diluted) 50 Stock price as of (or closest to) FY end 51 "Source: www.nada.com bige harte.com: Yahoo Finance 52 Growth rate of earnings (projected) (0,000 $ NMN 9,26 0.74 (0.63) 3 NMP 8.67 2.12 (2.00 $ NMN 7.66 7.00 (0,05) $ NMF 7.69 0.80 (0,83) NMF 6,70 0,58 $ NMP $ X x 0,15 x -7,31 x - 2009 1 0.40 0,82 3,81 0.46 16,18 0.83 6,90 0,22 5.99 -5614% 227.2% 21 500 0,07 6.80 34 772 -0,65 9.50 22 638 -7.07 7.69 20 804 -0.005 8,16 19 790 -11,83 3,88 17 257 8000 -1,76 2,308 23 54 Balance Sheet Income_Statement Cash_Flows RATIOS +