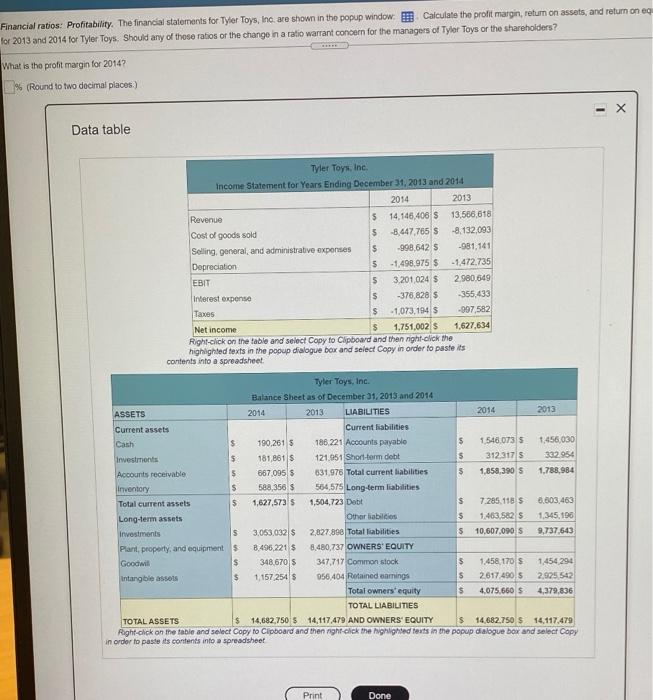
Financial ratios: Profitability. The financial statements for Tyler Toys, Inc. are shown in the popup window Calculate the profit margin return on assets, and return on eq Tor 2013 and 2014 for Tyler Toys. Should any of those ratios or the change in a ratio warrant concern for the managers of Tyler Toys or the shareholders? What is the profit margin for 2014? % (Round to two docimal places) Data table Tyler Toys, Inc Income Statement for Years Ending December 31, 2013 and 2014 2014 2013 Revenue $ 14,146,400 $ 13,586,618 Cost of goods sold 5 -8.447,765 S -8,132,093 Selling, general, and administrative expenses $ -998,6425 -981,141 Depreciation 5 -1,498,975 $ - 1.472.735 EBIT 5 3.201 024 5 2.980649 Interest expenso $ -376,820 -355,433 Taxes $ -1,073,194 $ -997,582 Net income $ 1,751,002 $ 1,627,634 Right click on the table and select Copy to clipboard and then night-click the highlighted texts in the popup dialogue box and select copy in order to paste its contents into a spreadsheet Tyler Toys, Inc. Balance Sheet as of December 31, 2013 and 2014 ASSETS 2014 2013 LIABILITIES 2014 2013 Current assets Current fiabilities Cash $ 190,261 S 186.221 Accounts payable 5 1546.073 5 1.456.030 $ Investments 181,8615 5 121.951 Short-term dobit 312,3175 332.954 Accounts receivable 5 667 095 $ 631976 Total current liabilities $ 1,858,390 1,788,984 Inventory 5 588,350 $ 564,575 Long-term liabilities Total current assets 5 1,627,573 $ 1,504,723 Debt $ 7.285.118 $ 6.603,463 Long-term assets Other abilities $ 1.463 562 1.345.196 Investments 5 3.053.032 $ 2,827 890 Total liabilities $ 10,607,090 9,737.643 Plant, property, and equipment 5 8.496,221 $ 8.480,737 OWNERS' EQUITY Goodwil $ 348 670 $ 347,717 Common stock $ 1,458 170 $ 1.454 294 Intangible assets $ 1.157 254 $ 056,404 Retained emings $ 2617 490.5 2,925 542 Total owners' equity $ 4,075,660 S 4,379,836 TOTAL LIABILITIES TOTAL ASSETS $ 14,682.750 $ 14,117,479 AND OWNERS' EQUITY $ 14,682.750 $ 14.117,479 Right click on the table and select Copy to clipboard and then righ-click the highlighted texts in the popup dialogue box and select Copy in order to paste its contents into spreadsheet Print Done


