- Financial Risks: Describe the potential impacts of the following types of financial risk on the company featured in the case study:
- Interest rate risk
- Economic risk
- Credit risk
- Operational risk
-
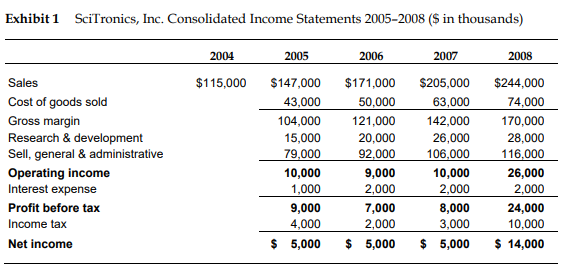
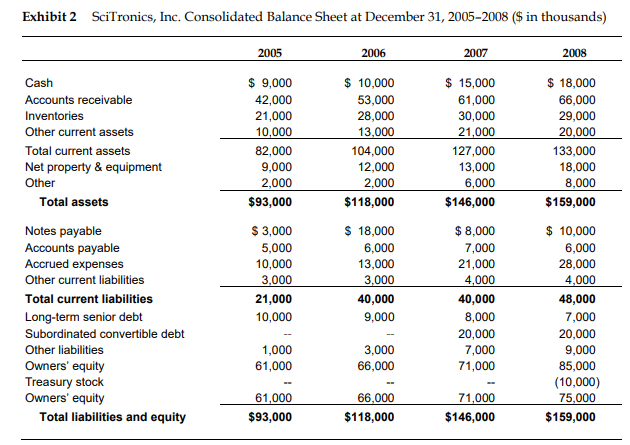
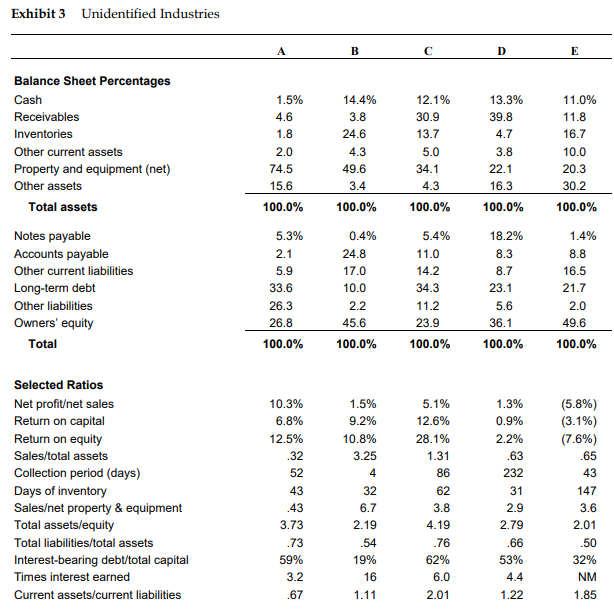
Exhibit 1 SciTronics, Inc. Consolidated Income Statements 2005-2008 ($ in thousands) 2008 2004 $115,000 Sales Cost of goods sold Gross margin Research & development Sell, general & administrative Operating income Interest expense Profit before tax Income tax Net income 2005 $147,000 43,000 104,000 15,000 79,000 10,000 1,000 9,000 4,000 $ 5,000 2006 $171,000 50,000 121,000 20,000 92,000 9,000 2,000 7,000 2,000 $ 5,000 2007 $205,000 63,000 142,000 26,000 106,000 10,000 2,000 8,000 3,000 $ 5,000 $244,000 74,000 170,000 28,000 116,000 26,000 2,000 24,000 10,000 $ 14,000 Exhibit 2 SciTronics, Inc. Consolidated Balance Sheet at December 31, 2005-2008 ($ in thousands) 2005 2006 2007 2008 Cash Accounts receivable Inventories Other current assets Total current assets Net property & equipment Other Total assets $ 9,000 42,000 21,000 10,000 82,000 9,000 2,000 $93,000 $ 10,000 53,000 28,000 13,000 104,000 12,000 2,000 $118,000 $ 15,000 61,000 30,000 21,000 127,000 13,000 6,000 $146,000 $ 18,000 66,000 29,000 20,000 133,000 18,000 8,000 $159,000 $ 3,000 5,000 10,000 3,000 21,000 10,000 Notes payable Accounts payable Accrued expenses Other current liabilities Total current liabilities Long-term senior debt Subordinated convertible debt Other liabilities Owners' equity Treasury stock Owners' equity Total liabilities and equity $ 18,000 6,000 13,000 3,000 40,000 9,000 $ 8,000 7,000 21,000 4,000 40,000 8,000 20,000 7,000 71,000 $ 10,000 6,000 28,000 4,000 48,000 7,000 20,000 9,000 85,000 (10,000) 75,000 $159,000 1,000 61,000 3,000 66,000 61,000 $93,000 66.000 $118,000 71,000 $146,000 Exhibit 3 Unidentified Industries B B D E Balance Sheet Percentages Cash Receivables Inventories Other current assets Property and equipment (net) Other assets Total assets 1.5% 4.6 1.8 2.0 74.5 15.6 14.4% 3.8 24.6 4.3 49.6 3.4 12.1% 30.9 13.7 5.0 34.1 4.3 13.3% 39.8 4.7 3.8 22.1 16.3 11.0% 11.8 16.7 10.0 20.3 30.2 100.0% 100.0% 100.0% 100.0% 100.0% 0.4% 24.8 17.0 Notes payable Accounts payable Other current liabilities Long-term debt Other liabilities Owners' equity Total 5.3% 2.1 5.9 33.6 26.3 26.8 100.0% 5.4% 11.0 14.2 34.3 11.2 23.9 100.0% 10.0 2.2 45.6 18.2% 8.3 8.7 23.1 5.6 36.1 100.0% 1.4% 8.8 16.5 21.7 2.0 49.6 100.0% 100.0% (5.8%) (3.1%) (7.6%) .65 Selected Ratios Net profitet sales Return on capital Return on equity Sales/total assets Collection period (days) Days of inventory Saleset property & equipment Total assets/equity Total liabilities/total assets Interest-bearing debt/total capital Times interest earned Current assets/current liabilities 1.3% 0.9% 2.2% .63 232 31 43 10.3% 6.8% 12.5% .32 52 43 .43 3.73 .73 59% 3.2 .67 1.5% 9.2% 10.8% 3.25 4 32 6.7 2.19 .54 19% 16 1.11 5.1% 12.6% 28.1% 1.31 86 62 3.8 4.19 .76 62% 6.0 2.9 147 3.6 2.01 .50 2.79 .66 53% 4.4 1.22 32% NM 1.85 2.01 Exhibit 1 SciTronics, Inc. Consolidated Income Statements 2005-2008 ($ in thousands) 2008 2004 $115,000 Sales Cost of goods sold Gross margin Research & development Sell, general & administrative Operating income Interest expense Profit before tax Income tax Net income 2005 $147,000 43,000 104,000 15,000 79,000 10,000 1,000 9,000 4,000 $ 5,000 2006 $171,000 50,000 121,000 20,000 92,000 9,000 2,000 7,000 2,000 $ 5,000 2007 $205,000 63,000 142,000 26,000 106,000 10,000 2,000 8,000 3,000 $ 5,000 $244,000 74,000 170,000 28,000 116,000 26,000 2,000 24,000 10,000 $ 14,000 Exhibit 2 SciTronics, Inc. Consolidated Balance Sheet at December 31, 2005-2008 ($ in thousands) 2005 2006 2007 2008 Cash Accounts receivable Inventories Other current assets Total current assets Net property & equipment Other Total assets $ 9,000 42,000 21,000 10,000 82,000 9,000 2,000 $93,000 $ 10,000 53,000 28,000 13,000 104,000 12,000 2,000 $118,000 $ 15,000 61,000 30,000 21,000 127,000 13,000 6,000 $146,000 $ 18,000 66,000 29,000 20,000 133,000 18,000 8,000 $159,000 $ 3,000 5,000 10,000 3,000 21,000 10,000 Notes payable Accounts payable Accrued expenses Other current liabilities Total current liabilities Long-term senior debt Subordinated convertible debt Other liabilities Owners' equity Treasury stock Owners' equity Total liabilities and equity $ 18,000 6,000 13,000 3,000 40,000 9,000 $ 8,000 7,000 21,000 4,000 40,000 8,000 20,000 7,000 71,000 $ 10,000 6,000 28,000 4,000 48,000 7,000 20,000 9,000 85,000 (10,000) 75,000 $159,000 1,000 61,000 3,000 66,000 61,000 $93,000 66.000 $118,000 71,000 $146,000 Exhibit 3 Unidentified Industries B B D E Balance Sheet Percentages Cash Receivables Inventories Other current assets Property and equipment (net) Other assets Total assets 1.5% 4.6 1.8 2.0 74.5 15.6 14.4% 3.8 24.6 4.3 49.6 3.4 12.1% 30.9 13.7 5.0 34.1 4.3 13.3% 39.8 4.7 3.8 22.1 16.3 11.0% 11.8 16.7 10.0 20.3 30.2 100.0% 100.0% 100.0% 100.0% 100.0% 0.4% 24.8 17.0 Notes payable Accounts payable Other current liabilities Long-term debt Other liabilities Owners' equity Total 5.3% 2.1 5.9 33.6 26.3 26.8 100.0% 5.4% 11.0 14.2 34.3 11.2 23.9 100.0% 10.0 2.2 45.6 18.2% 8.3 8.7 23.1 5.6 36.1 100.0% 1.4% 8.8 16.5 21.7 2.0 49.6 100.0% 100.0% (5.8%) (3.1%) (7.6%) .65 Selected Ratios Net profitet sales Return on capital Return on equity Sales/total assets Collection period (days) Days of inventory Saleset property & equipment Total assets/equity Total liabilities/total assets Interest-bearing debt/total capital Times interest earned Current assets/current liabilities 1.3% 0.9% 2.2% .63 232 31 43 10.3% 6.8% 12.5% .32 52 43 .43 3.73 .73 59% 3.2 .67 1.5% 9.2% 10.8% 3.25 4 32 6.7 2.19 .54 19% 16 1.11 5.1% 12.6% 28.1% 1.31 86 62 3.8 4.19 .76 62% 6.0 2.9 147 3.6 2.01 .50 2.79 .66 53% 4.4 1.22 32% NM 1.85 2.01