Answered step by step
Verified Expert Solution
Question
1 Approved Answer
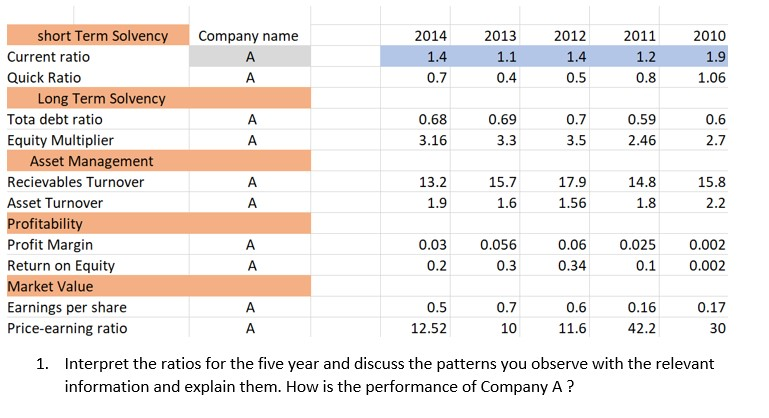
Financial statement Analysis 2011 Company name 2014 1.4 0.7 2013 1.1 0.4 2012 1.4 0.5 1.2 2010 1.9 1.06 0.8 A A 0.68 3.16 0.69

Financial statement Analysis
2011 Company name 2014 1.4 0.7 2013 1.1 0.4 2012 1.4 0.5 1.2 2010 1.9 1.06 0.8 A A 0.68 3.16 0.69 3.3 0.7 3.5 0.59 2.46 0.6 2.7 short Term Solvency Current ratio Quick Ratio Long Term Solvency Tota debt ratio Equity Multiplier Asset Management Recievables Turnover Asset Turnover Profitability Profit Margin Return on Equity Market Value Earnings per share Price-earning ratio A 13.2 1.9 15.7 1.6 17.9 1.56 14.8 1.8 15.8 2.2 A A A 0.03 0.2 0.056 0.3 0.06 0.34 0.025 0.1 0.002 0.002 A 0.5 12.52 0.7 10 0.6 11.6 0.16 42.2 0.17 30 1. Interpret the ratios for the five year and discuss the patterns you observe with the relevant information and explain them. How is the performance of Company AStep by Step Solution
There are 3 Steps involved in it
Step: 1

Get Instant Access to Expert-Tailored Solutions
See step-by-step solutions with expert insights and AI powered tools for academic success
Step: 2

Step: 3

Ace Your Homework with AI
Get the answers you need in no time with our AI-driven, step-by-step assistance
Get Started


