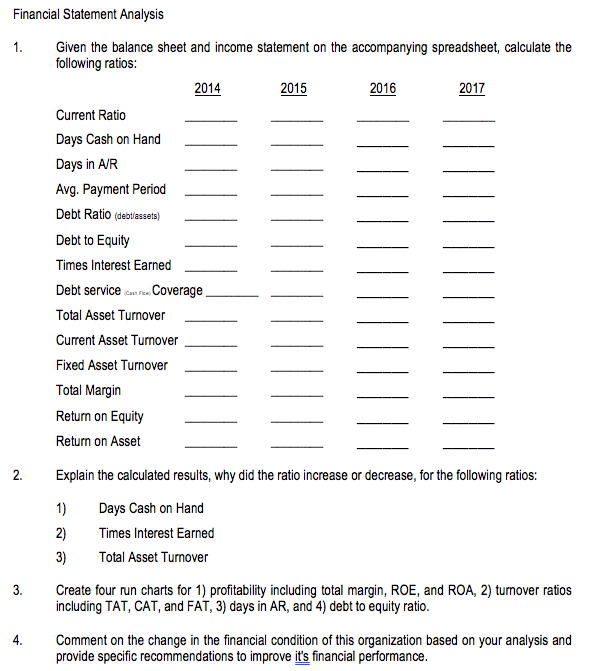
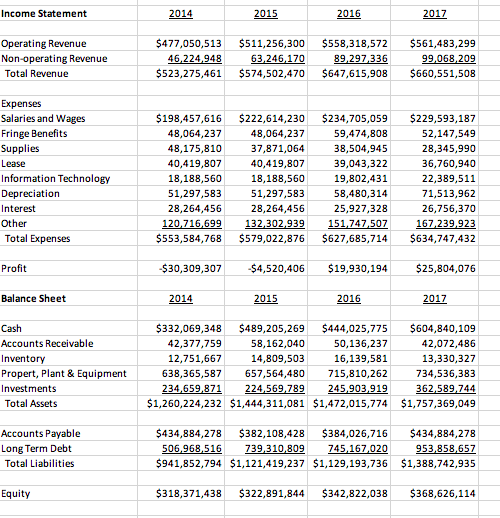
Financial Statement Analysis Given the balance sheet and income statement on the accompanying spreadsheet, calculate the following ratios: 1 2015 2014 2016 2017 Current Ratio Days Cash on Hand Days in A/R Avg. Payment Period Debt Ratio (debtlessets) Debt to Equity Times Interest Earned Debt service EAFrea overage Casn Fice Total Asset Turnover Current Asset Turnover Fixed Asset Turnover Total Margin Return on Equity Return on Asset Explain the calculated results, why did the ratio increase or decrease, for the following ratios 2. Days Cash on Hand 1) 2) Times Interest Earned 3) Total Asset Tumover Create four run charts for 1) profitability including total margin, ROE, and ROA, 2) tumover ratios including TAT, CAT, and FAT, 3) days in AR, and 4) debt to equity ratio 3 Comment on the change in the financial condition of this organization based on your analysis and provide specific recommendations to improve it's financial performance. 4. 2017 Income Statement 2014 2015 2016 Operating Revenue Non-operating Revenue $477,050,513 $511,256,300 $558,318,572 $561,483,299 46,224,948 63,246,170 89,297,336 $647,615,908 99,068,209 Total Revenue $523,275,461 $574,502,470 $660,551,508 Expenses Salaries and Wages $198,457,616 $222,614,230 $234,705,059 $229,593,187 Fringe Benefits Supplies 48,064,237 48,064,237 59,474,808 52,147,549 37,871,064 28,345,990 48,175,810 38,504,945 36,760,940 Lease 40,419,807 40,419,807 39,043,322 Information Technology 18,188,560 18,188,560 19,802,431 22,389,511 Depreciation 51,297,583 51,297,583 58,480,314 71,513,962 Interest 28,264,456 28,264,456 25,927,328 26,756,370 Other 120,716,699 $553,584,768 132,302,939 151,747,507 $627,685,714 167,239,923 Total Expenses $579,022,876 $634,747,432 Profit -$30,309,307 -$4,520,406 $19,930,194 $25,804,076 Balance Sheet 2014 2015 2016 2017 Cash $332,069,348 $489,205,269 $444,025,775 $604,840,109 Accounts Receivable 42,072,486 42,377,759 58,162,040 50,136,237 Inventory 12,751,667 14,809,503 16,139,581 13,330,327 Propert, Plant & Equipment 657,564,480 715,810,262 638,365,587 734,536,383 Investments 234,659,871 224,569,789 245,903,919 362,589,744 Total Assets $1,260,224,232 $1,444,311,081 $1,472,015,774 $1,757,369,049 Accounts Payable Long Term Debt $434,884,278 $382,108,428 $384,026,716 $434,884,278 506,968,516 739,310,809 745,167,020 953,858,657 Total Liabilities $941,852,794 $1,121,419,237 $1,129,193,736 $1,388,742,935 $318,371,438 $322,891,844 $342,822,038 $368,626,114 Equity Financial Statement Analysis Given the balance sheet and income statement on the accompanying spreadsheet, calculate the following ratios: 1 2015 2014 2016 2017 Current Ratio Days Cash on Hand Days in A/R Avg. Payment Period Debt Ratio (debtlessets) Debt to Equity Times Interest Earned Debt service EAFrea overage Casn Fice Total Asset Turnover Current Asset Turnover Fixed Asset Turnover Total Margin Return on Equity Return on Asset Explain the calculated results, why did the ratio increase or decrease, for the following ratios 2. Days Cash on Hand 1) 2) Times Interest Earned 3) Total Asset Tumover Create four run charts for 1) profitability including total margin, ROE, and ROA, 2) tumover ratios including TAT, CAT, and FAT, 3) days in AR, and 4) debt to equity ratio 3 Comment on the change in the financial condition of this organization based on your analysis and provide specific recommendations to improve it's financial performance. 4. 2017 Income Statement 2014 2015 2016 Operating Revenue Non-operating Revenue $477,050,513 $511,256,300 $558,318,572 $561,483,299 46,224,948 63,246,170 89,297,336 $647,615,908 99,068,209 Total Revenue $523,275,461 $574,502,470 $660,551,508 Expenses Salaries and Wages $198,457,616 $222,614,230 $234,705,059 $229,593,187 Fringe Benefits Supplies 48,064,237 48,064,237 59,474,808 52,147,549 37,871,064 28,345,990 48,175,810 38,504,945 36,760,940 Lease 40,419,807 40,419,807 39,043,322 Information Technology 18,188,560 18,188,560 19,802,431 22,389,511 Depreciation 51,297,583 51,297,583 58,480,314 71,513,962 Interest 28,264,456 28,264,456 25,927,328 26,756,370 Other 120,716,699 $553,584,768 132,302,939 151,747,507 $627,685,714 167,239,923 Total Expenses $579,022,876 $634,747,432 Profit -$30,309,307 -$4,520,406 $19,930,194 $25,804,076 Balance Sheet 2014 2015 2016 2017 Cash $332,069,348 $489,205,269 $444,025,775 $604,840,109 Accounts Receivable 42,072,486 42,377,759 58,162,040 50,136,237 Inventory 12,751,667 14,809,503 16,139,581 13,330,327 Propert, Plant & Equipment 657,564,480 715,810,262 638,365,587 734,536,383 Investments 234,659,871 224,569,789 245,903,919 362,589,744 Total Assets $1,260,224,232 $1,444,311,081 $1,472,015,774 $1,757,369,049 Accounts Payable Long Term Debt $434,884,278 $382,108,428 $384,026,716 $434,884,278 506,968,516 739,310,809 745,167,020 953,858,657 Total Liabilities $941,852,794 $1,121,419,237 $1,129,193,736 $1,388,742,935 $318,371,438 $322,891,844 $342,822,038 $368,626,114 Equity