- Financial Statement Analysis
Predict the next years of projected balance statements, for Kohls Corporation Balance sheets starting with the most recent year after the companys last issued report.
-
- Projections should be based on research performed on your company and its industry. Use historical, trend, ratio data and current and future economic projections as well as information from the companys MD&A to aid in preparing projections.
- Clearly state your assumptions in a text box at the bottom of each tab. Cite sources for assumptions based on research.
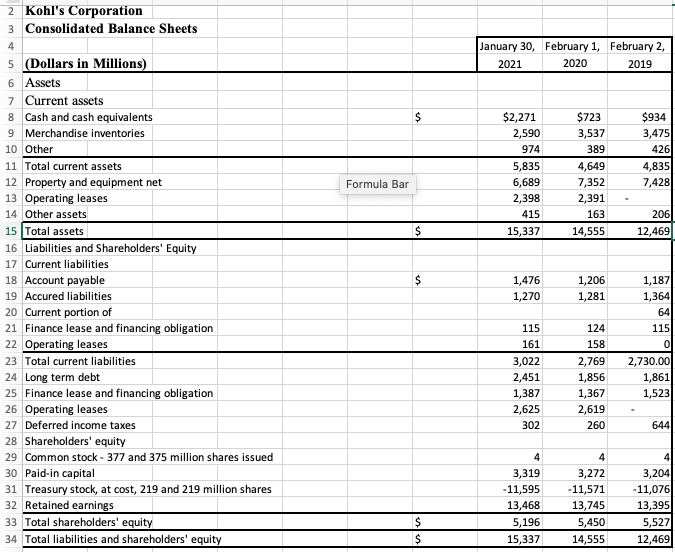
- This is the information I receive and was told it is correct.
2 Kohl's Corporation 3 Consolidated Balance Sheets 4 January 30, February 1, February 2, 2021 2020 2019 $2,271 2,590 974 5,835 6,689 2,398 415 15,337 $723 3,537 389 4,649 7,352 2,391 163 14,555 $934 3,475 426 4,835 7,428 Formula Bar 206 12,469 1,476 1,270 5 (Dollars in Millions) 6 Assets 7 Current assets 8 Cash and cash equivalents 9 Merchandise inventories 10 Other 11 Total current assets 12 Property and equipment net 13 Operating leases 14 Other assets 15 Total assets 16 Liabilities and Shareholders' Equity 17 Current liabilities 18 Account payable 19 Accured liabilities 20 Current portion of 21 Finance lease and financing obligation 22 Operating leases 23 Total current liabilities 24 Long term debt 25 Finance lease and financing obligation 26 Operating leases 27 Deferred income taxes 28 Shareholders' equity 29 Common stock - 377 and 375 million shares issued 30 Paid-in capital 31 Treasury stock, at cost, 219 and 219 million shares 32 Retained earnings 33 Total shareholders' equity 34 Total liabilities and shareholders' equity 1,206 1,281 1,187 1,364 64 115 115 161 3,022 2,451 1,387 2,625 302 124 158 2,769 1,856 1,367 2,619 260 0 2,730.00 1,861 1,523 644 4 3,319 -11,595 13,468 5,196 15,337 4 3,272 -11,571 13,745 5,450 14,555 4 3,204 -11,076 13,395 5,527 12,469 $ $ 2 Kohl's Corporation 3 Consolidated Balance Sheets 4 January 30, February 1, February 2, 2021 2020 2019 $2,271 2,590 974 5,835 6,689 2,398 415 15,337 $723 3,537 389 4,649 7,352 2,391 163 14,555 $934 3,475 426 4,835 7,428 Formula Bar 206 12,469 1,476 1,270 5 (Dollars in Millions) 6 Assets 7 Current assets 8 Cash and cash equivalents 9 Merchandise inventories 10 Other 11 Total current assets 12 Property and equipment net 13 Operating leases 14 Other assets 15 Total assets 16 Liabilities and Shareholders' Equity 17 Current liabilities 18 Account payable 19 Accured liabilities 20 Current portion of 21 Finance lease and financing obligation 22 Operating leases 23 Total current liabilities 24 Long term debt 25 Finance lease and financing obligation 26 Operating leases 27 Deferred income taxes 28 Shareholders' equity 29 Common stock - 377 and 375 million shares issued 30 Paid-in capital 31 Treasury stock, at cost, 219 and 219 million shares 32 Retained earnings 33 Total shareholders' equity 34 Total liabilities and shareholders' equity 1,206 1,281 1,187 1,364 64 115 115 161 3,022 2,451 1,387 2,625 302 124 158 2,769 1,856 1,367 2,619 260 0 2,730.00 1,861 1,523 644 4 3,319 -11,595 13,468 5,196 15,337 4 3,272 -11,571 13,745 5,450 14,555 4 3,204 -11,076 13,395 5,527 12,469 $ $