Question
Financial Statement and Ratio Analysis Clara Oswald is the majority shareholder of Oswald's Impossibilities. In 2011, she launched a major expansion of the business
Financial Statement and Ratio Analysis
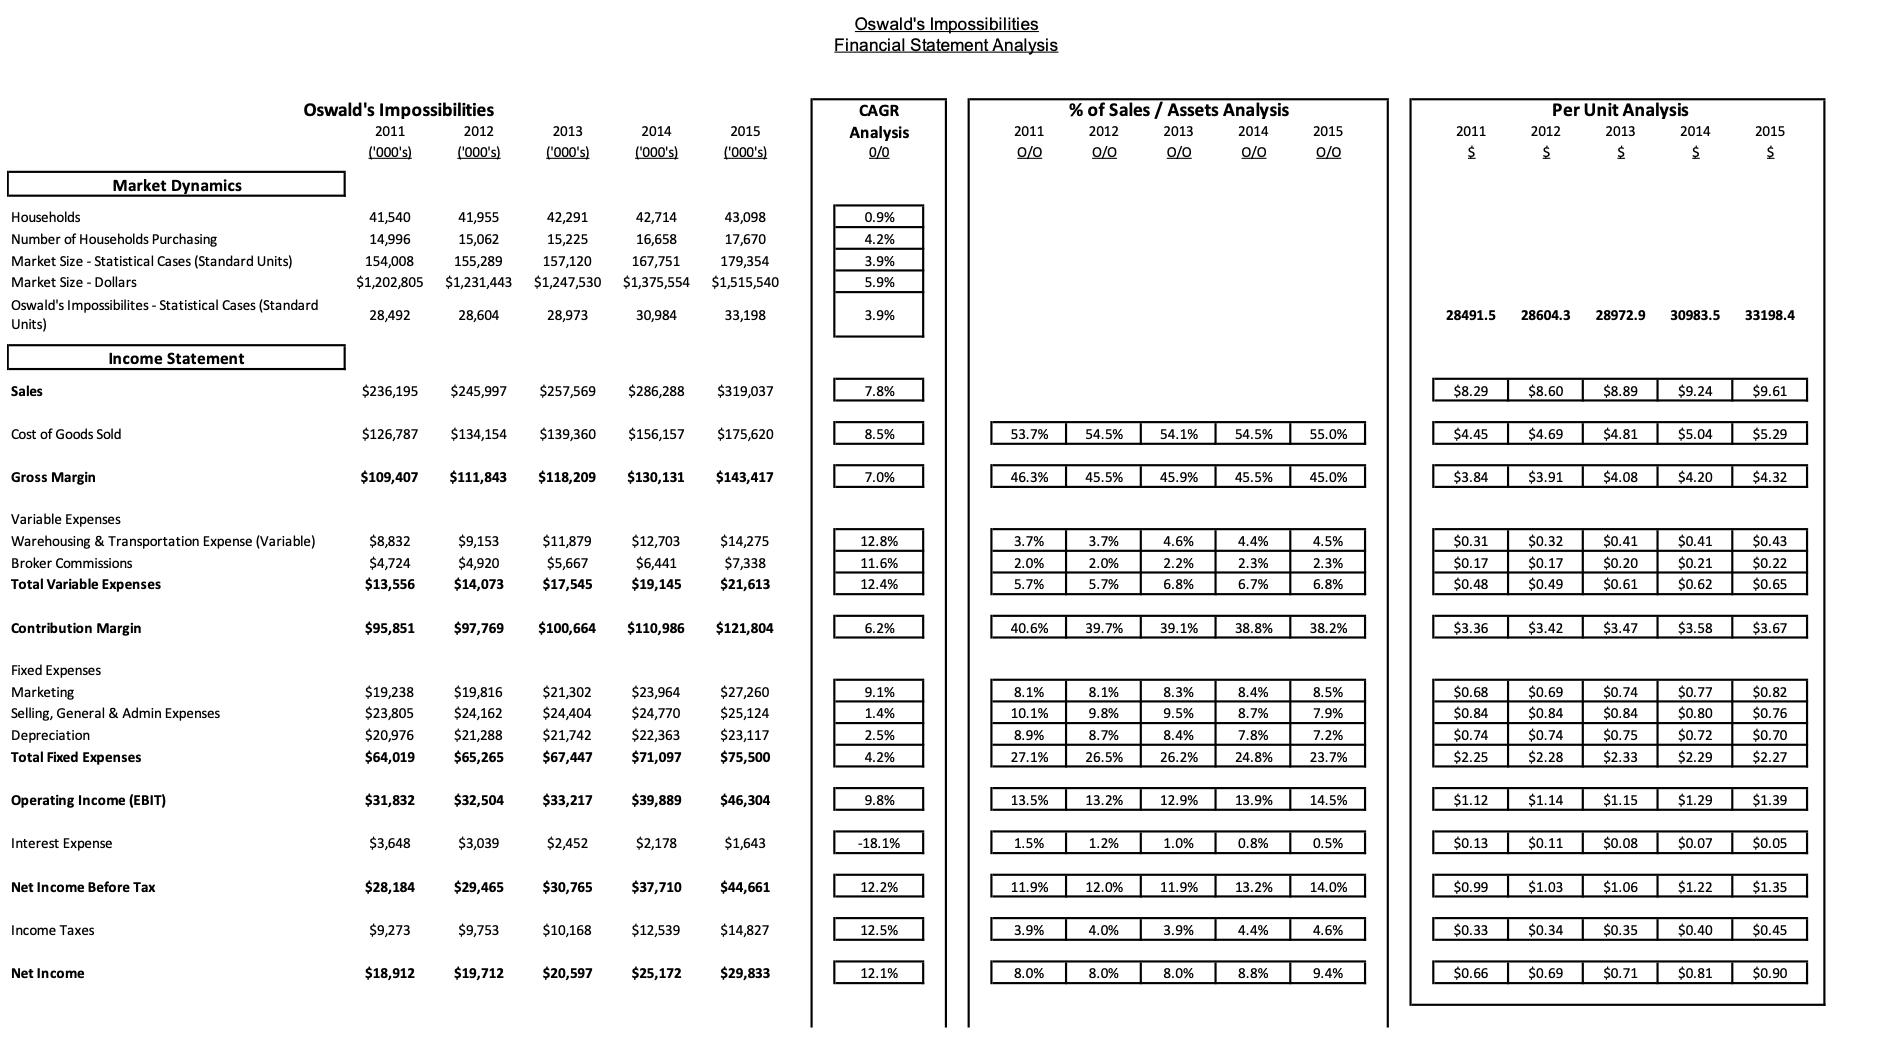
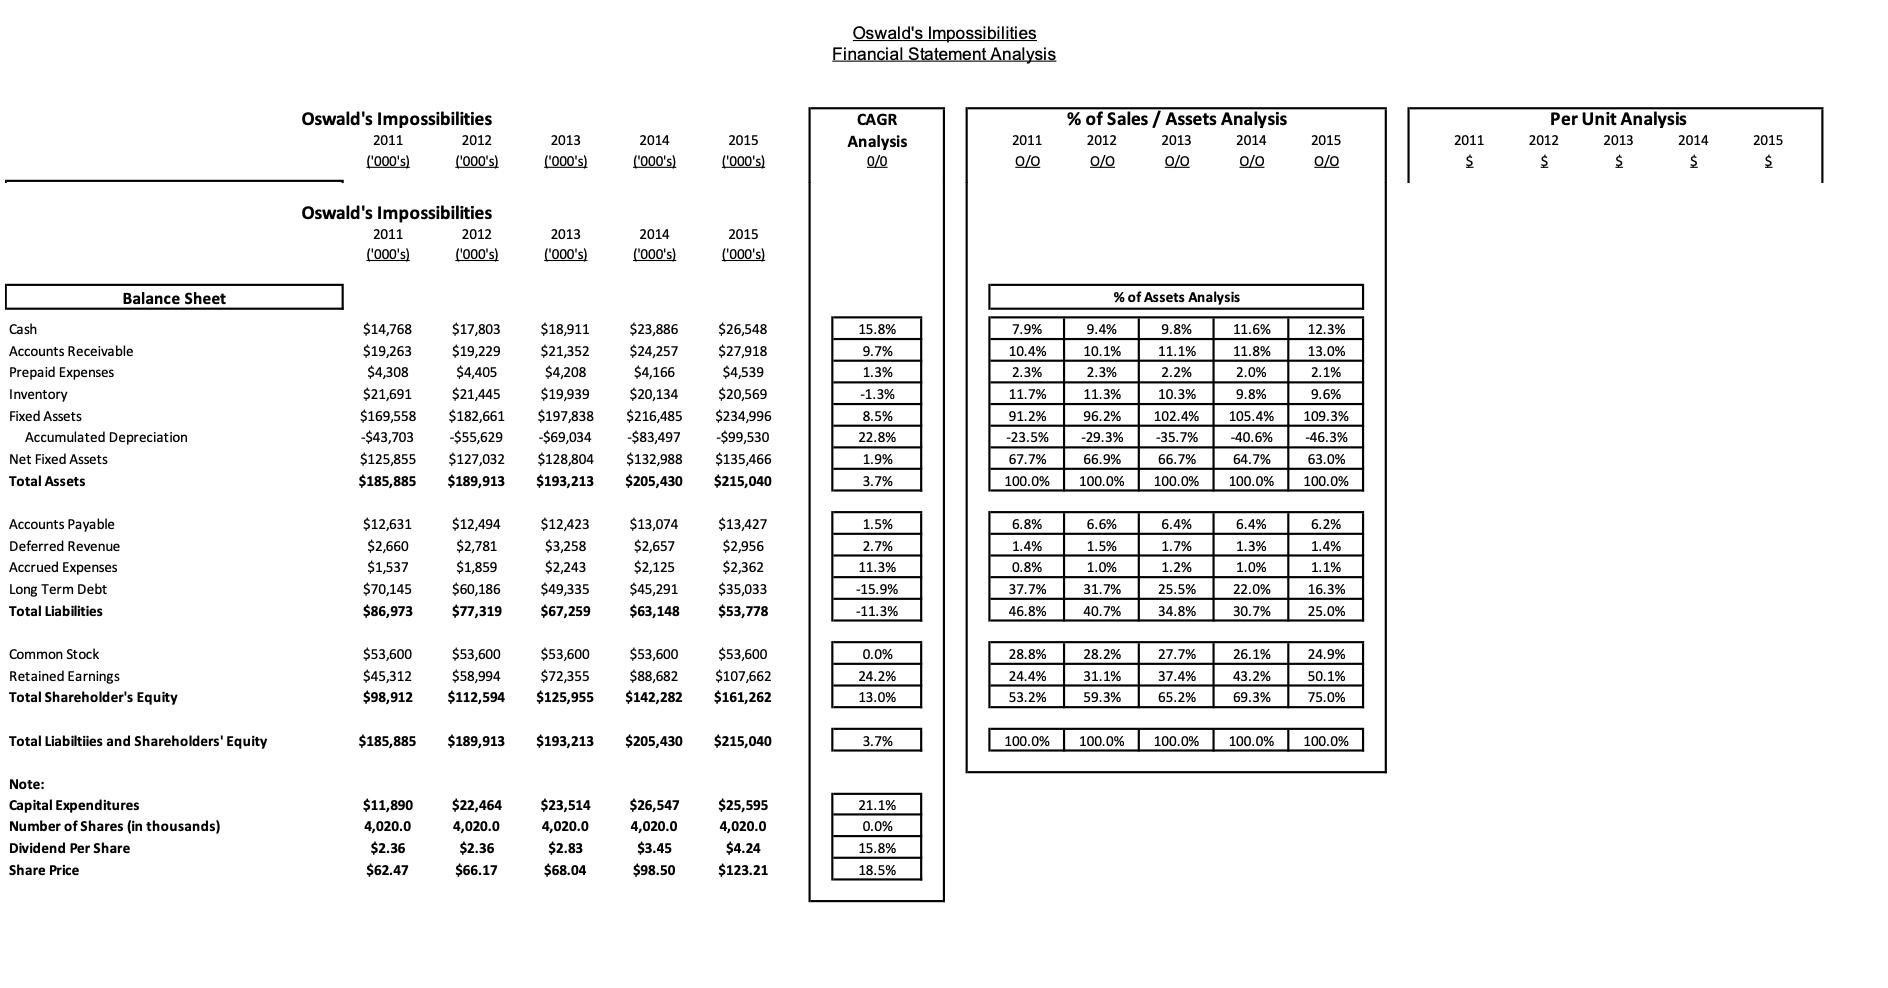
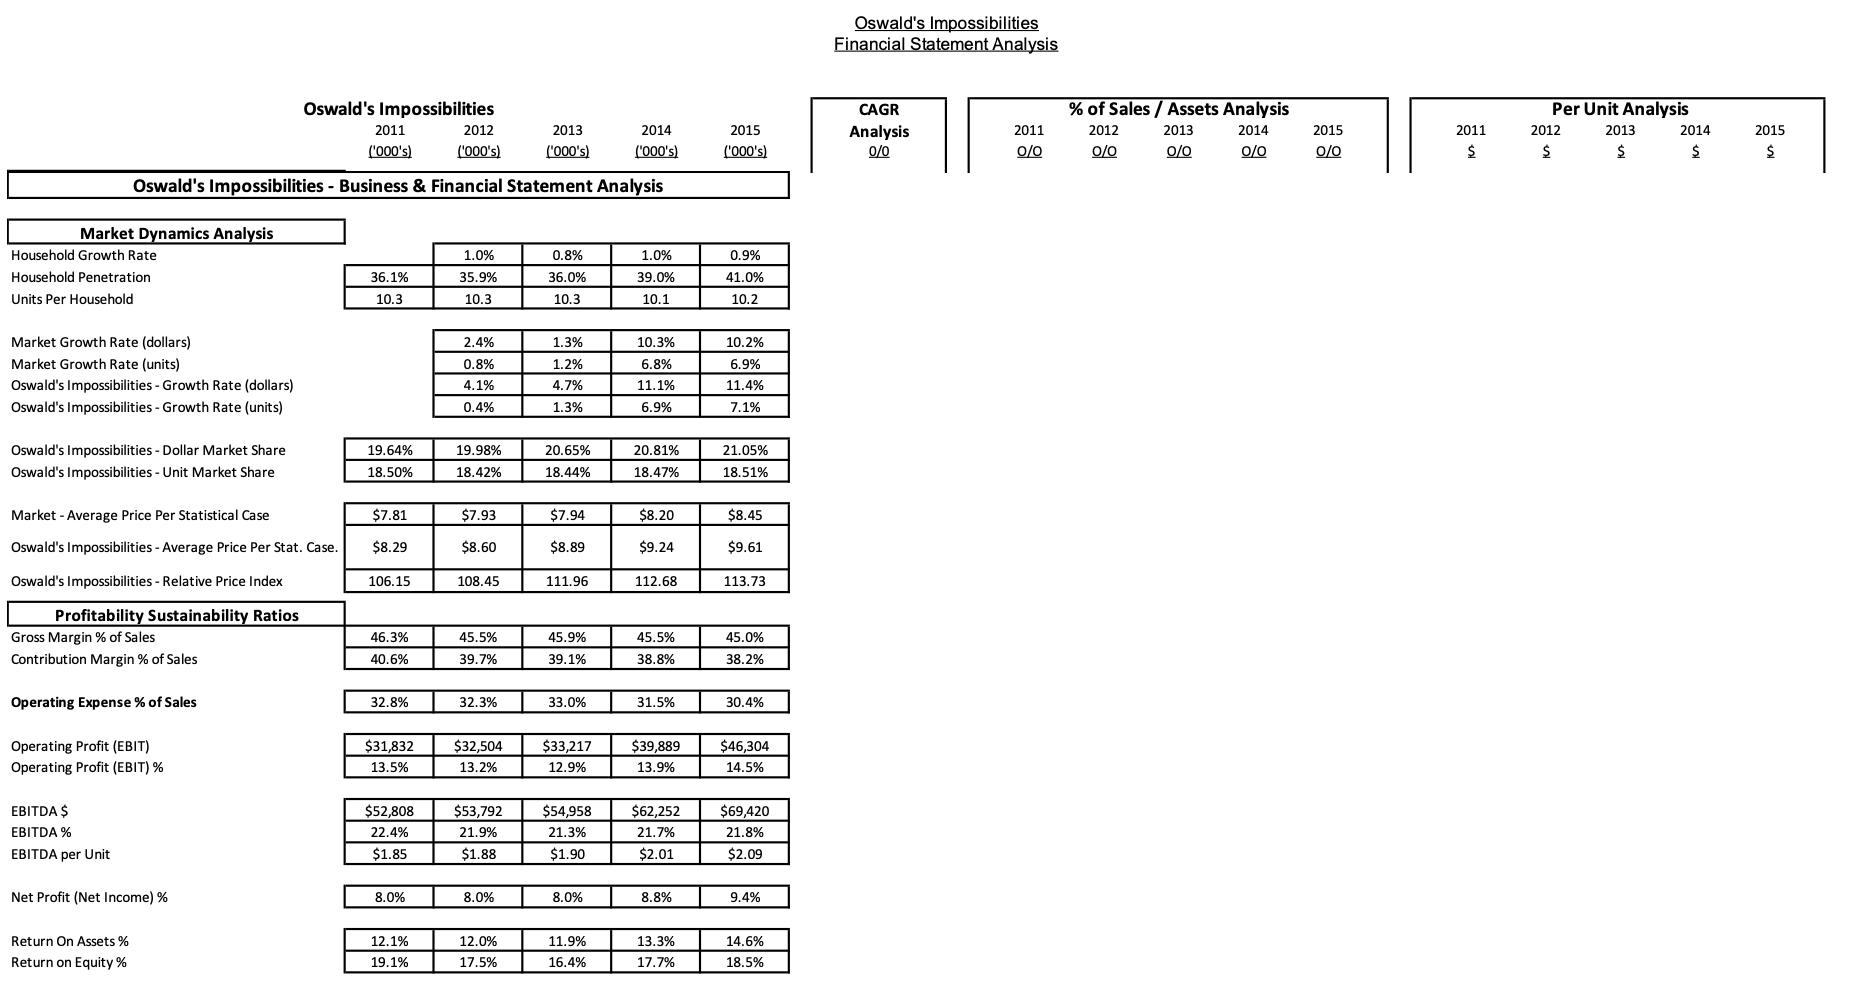
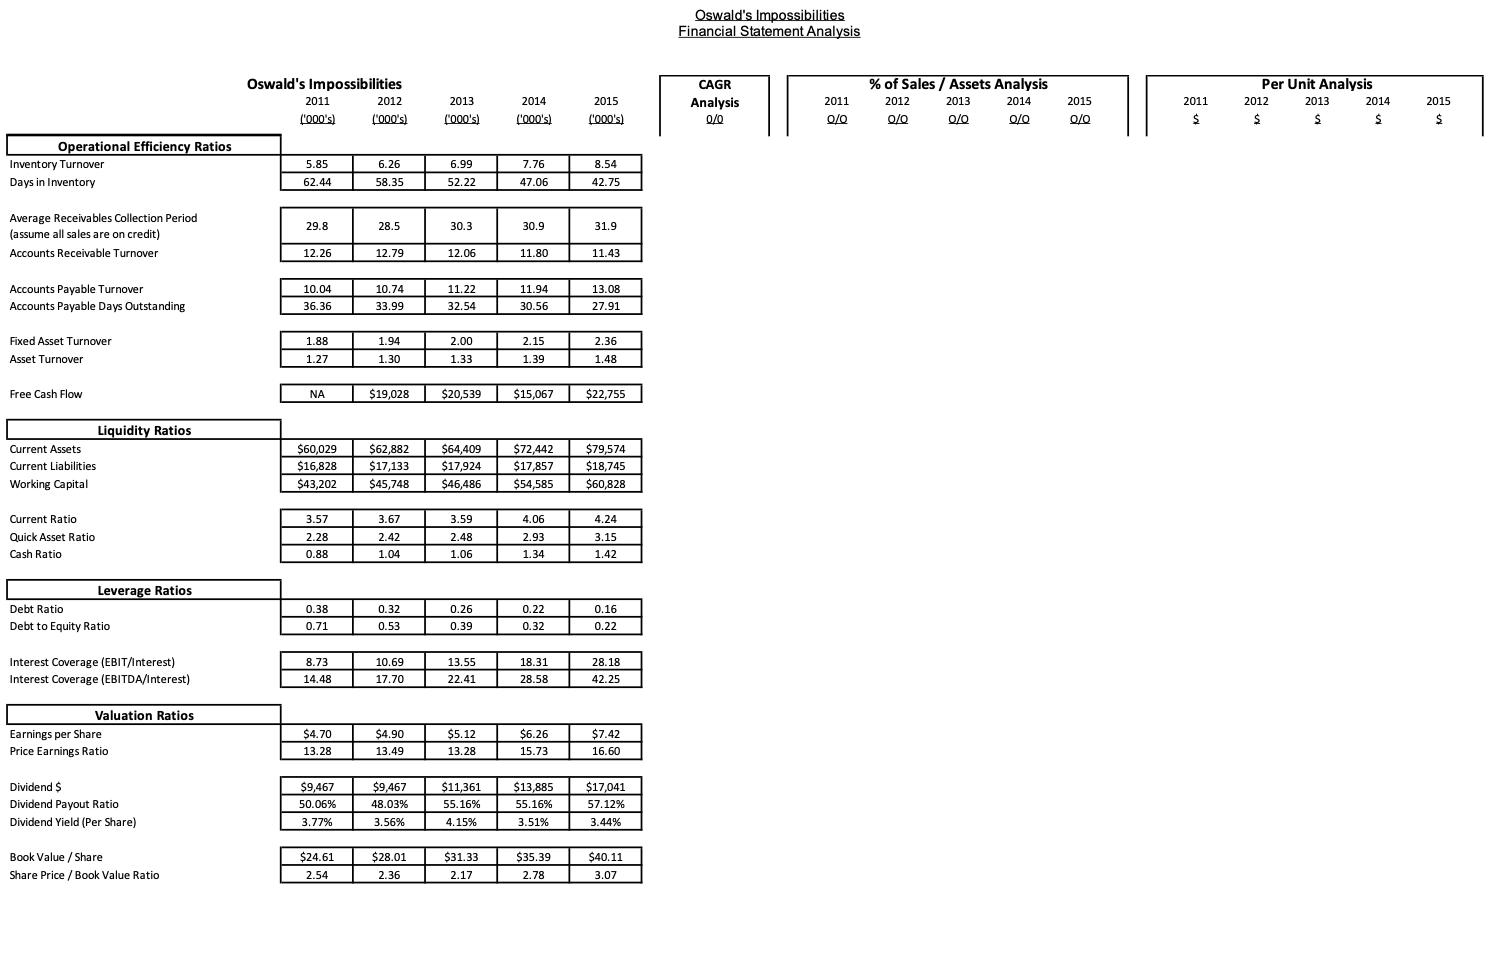
Clara Oswald is the majority shareholder of Oswald's Impossibilities. In 2011, she launched a major expansion of the business and is now looking to understand how the business is performing and its financial condition. The financial statements and operating metrics for the business' last five years of operation are included on the appropriate "Oswald's Impossibilities" tab for your version of the exam.
Clara has asked you to do a comprehensive analysis of the company's recent financial performance using the well-known financial ratios as well as looking at market dynamics, CAGR, % of sales, per unit and any other appropriate measures.
In the following section, you are to provide an analysis of the specified aspect of Oswald Impossibilities business and financial performance. Your analysis is to be based solely on your review of Oswald's Impossibilities' operating metrics, and financial statements and ratios. Where are they doing well? Are there areas of concern? What are the implications for the company's future performance? Where-ever appropriate, please support your answers with the inclusion of specific metrics from your spreadsheet (i.e. you should provide the specific growth rate).
After analyzing each individual area, you will then be required to provide an overall assessment of the company's results and future business prospects. Remember to support all your analysis and assessment with specific facts and metrics from the financial statements and ratio spreadsheet.
Market Dynamics:
- Including but not limited to household & market growth rates, penetration rate, units per household, average price per unit & relative price index, market and company growth rate in units and dollars, Oswald's Impossibilities market share in units and dollars
Vertical & Horizontal Analysis:
- Income statement - % of sales analysis and $ / unit analysis for all appropriate income statement lines
- Balance sheet - % of assets analysis
- Income Statement & Balance Sheet - CAGR (compounded annual growth rate) between 2011 and 2015
Financial Ratio Analysis - Profitability Sustainability Ratios:
Financial Ratio Analysis - Operational Efficiency Ratios:
Financial Ratio Analysis - Liquidity Ratios:
Financial Ratio Analysis - Leverage Ratios:
Financial Ratio Analysis - Valuation Ratios:
Overall (Summary) Assessment:
Based on all of the analysis that you have completed so far, provide an overall assessment of the company's results to date and its future business prospects. What aspects of the business are currently doing well? Where are the challenges? Are there any major issues that the company will face in the next 3 to 5 years. Remember to support your assessment with specific facts and metrics from the financial statements and ratio analysis that you have just completed.


Oswald's Impossibilities 2011 ('000's) Oswald's Impossibilities Financial Statement Analysis 2012 2013 2014 ('000's) ('000's) ('000's) 2015 ('000's) CAGR Analysis 0/0 % of Sales / Assets Analysis Per Unit Analysis 2011 2012 2013 2014 2015 2011 2012 2013 2014 2015 0/0 0/0 0/0 0/0 0/0 $ $ $ $ $ Market Dynamics Households 41,540 41,955 42,291 42,714 43,098 0.9% Number of Households Purchasing 14,996 Market Size - Statistical Cases (Standard Units) Market Size - Dollars 15,062 15,225 16,658 154,008 155,289 157,120 167,751 $1,202,805 $1,231,443 $1,247,530 $1,375,554 17,670 4.2% 179,354 3.9% $1,515,540 5.9% Oswald's Impossibilites - Statistical Cases (Standard Units) 28,492 28,604 28,973 30,984 33,198 3.9% Income Statement Sales Cost of Goods Sold 28491.5 28604.3 28972.9 30983.5 33198.4 $236,195 $245,997 $257,569 $286,288 $319,037 7.8% $8.29 $8.60 $8.89 $9.24 $9.61 $126,787 $134,154 $139,360 $156,157 $175,620 8.5% 53.7% 54.5% 54.1% 54.5% 55.0% $4.45 $4.69 $4.81 $5.04 $5.29 $109,407 $111,843 $118,209 $130,131 $143,417 7.0% 46.3% 45.5% 45.9% 45.5% 45.0% $3.84 $3.91 $4.08 $4.20 $4.32 Gross Margin Variable Expenses Warehousing & Transportation Expense (Variable) $8,832 Broker Commissions $4,724 Total Variable Expenses $13,556 $9,153 $4,920 $14,073 $11,879 $5,667 $17,545 $12,703 $6,441 $19,145 $14,275 12.8% 3.7% 3.7% 4.6% 4.4% 4.5% $0.31 $0.32 $0.41 $0.41 $0.43 $7,338 11.6% 2.0% 2.0% 2.2% 2.3% 2.3% $0.17 $0.17 $0.20 $0.21 $0.22 $21,613 12.4% 5.7% 5.7% 6.8% 6.7% 6.8% $0.48 $0.49 $0.61 $0.62 $0.65 Contribution Margin $95,851 $97,769 $100,664 $110,986 $121,804 6.2% 40.6% 39.7% 39.1% 38.8% 38.2% $3.36 $3.42 $3.47 $3.58 $3.67 Fixed Expenses Marketing $19,238 $19,816 $21,302 $23,964 $27,260 9.1% 8.1% 8.1% 8.3% 8.4% 8.5% $0.68 $0.69 $0.74 $0.77 $0.82 Selling, General & Admin Expenses $23,805 $24,162 $24,404 $24,770 $25,124 1.4% 10.1% 9.8% 9.5% 8.7% 7.9% $0.84 $0.84 $0.84 $0.80 $0.76 Depreciation $20,976 $21,288 $21,742 $22,363 $23,117 2.5% 8.9% 8.7% 8.4% 7.8% 7.2% $0.74 $0.74 $0.75 $0.72 $0.70 Total Fixed Expenses $64,019 $65,265 $67,447 $71,097 $75,500 4.2% 27.1% 26.5% 26.2% 24.8% 23.7% $2.25 $2.28 $2.33 $2.29 $2.27 Operating Income (EBIT) $31,832 $32,504 $33,217 $39,889 $46,304 9.8% 13.5% 13.2% 12.9% 13.9% 14.5% $1.12 $1.14 $1.15 $1.29 $1.39 Interest Expense $3,648 $3,039 $2,452 $2,178 $1,643 -18.1% 1.5% 1.2% 1.0% 0.8% 0.5% $0.13 $0.11 $0.08 $0.07 $0.05 Net Income Before Tax $28,184 $29,465 $30,765 $37,710 $44,661 12.2% 11.9% 12.0% 11.9% 13.2% 14.0% $0.99 $1.03 $1.06 $1.22 $1.35 Income Taxes $9,273 $9,753 $10,168 $12,539 $14,827 12.5% 3.9% 4.0% 3.9% 4.4% 4.6% $0.33 $0.34 $0.35 $0.40 $0.45 Net Income $18,912 $19,712 $20,597 $25,172 $29,833 12.1% 8.0% 8.0% 8.0% 8.8% 9.4% $0.66 $0.69 $0.71 $0.81 $0.90
Step by Step Solution
There are 3 Steps involved in it
Step: 1

Get Instant Access to Expert-Tailored Solutions
See step-by-step solutions with expert insights and AI powered tools for academic success
Step: 2

Step: 3

Ace Your Homework with AI
Get the answers you need in no time with our AI-driven, step-by-step assistance
Get Started


