

Question: financial statement Question KPMG Taseer Hadi & Co. as the Auditors of the Company for the year 2019, subject to Shareholders' approval at the next
financial statement
Question
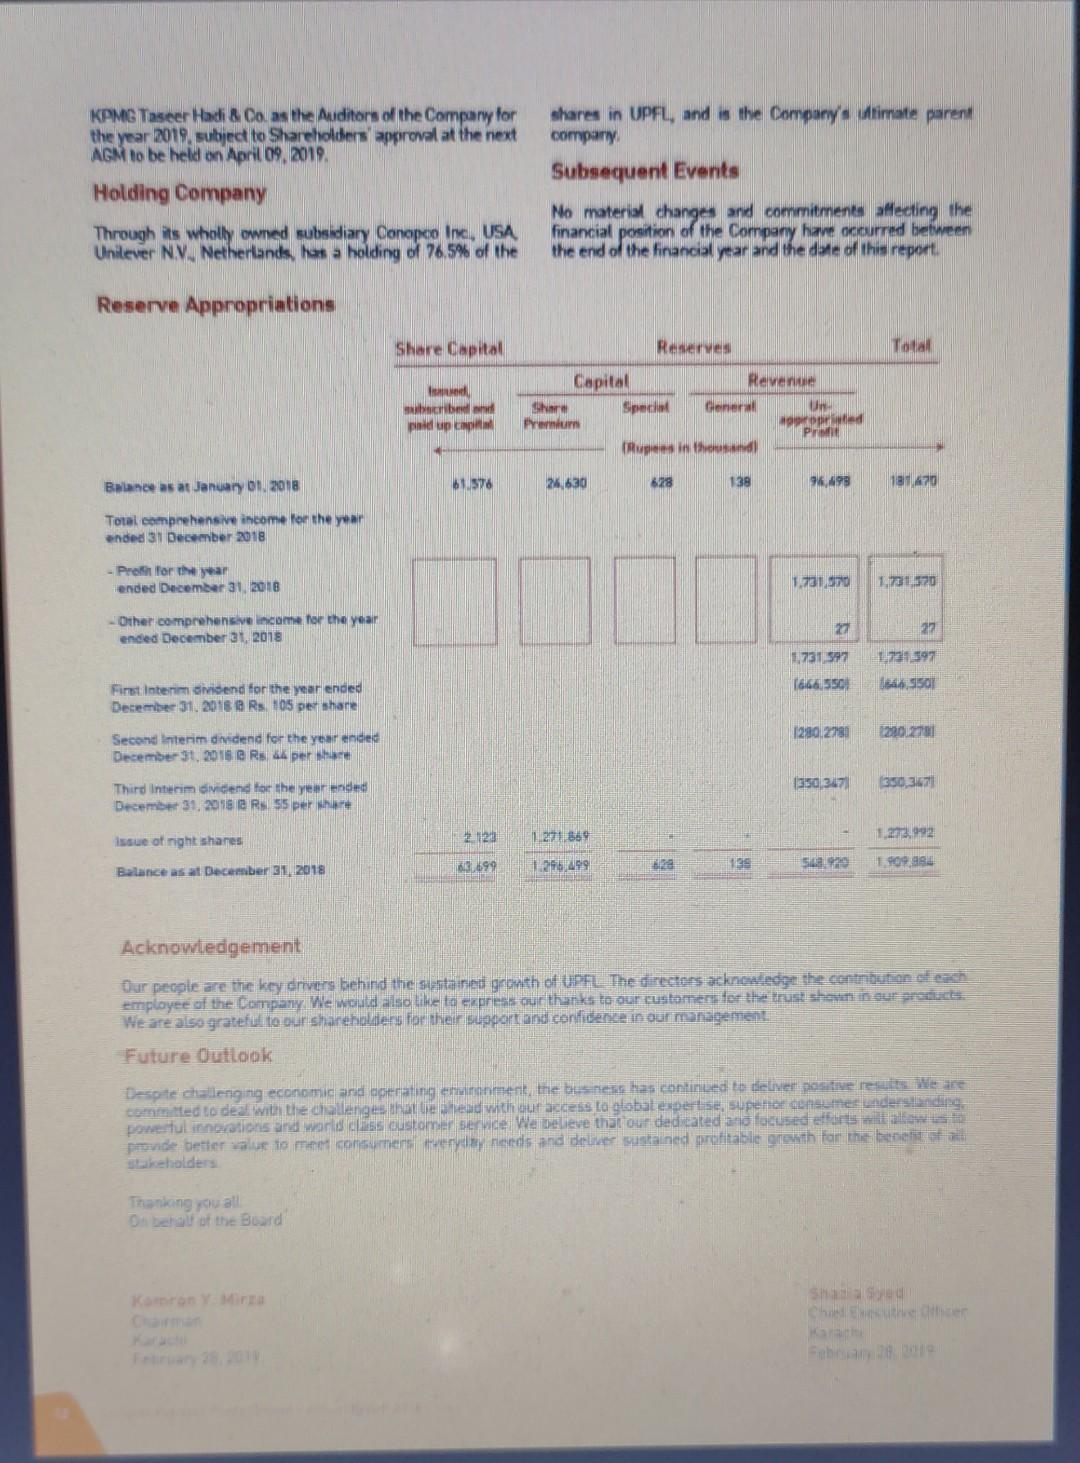
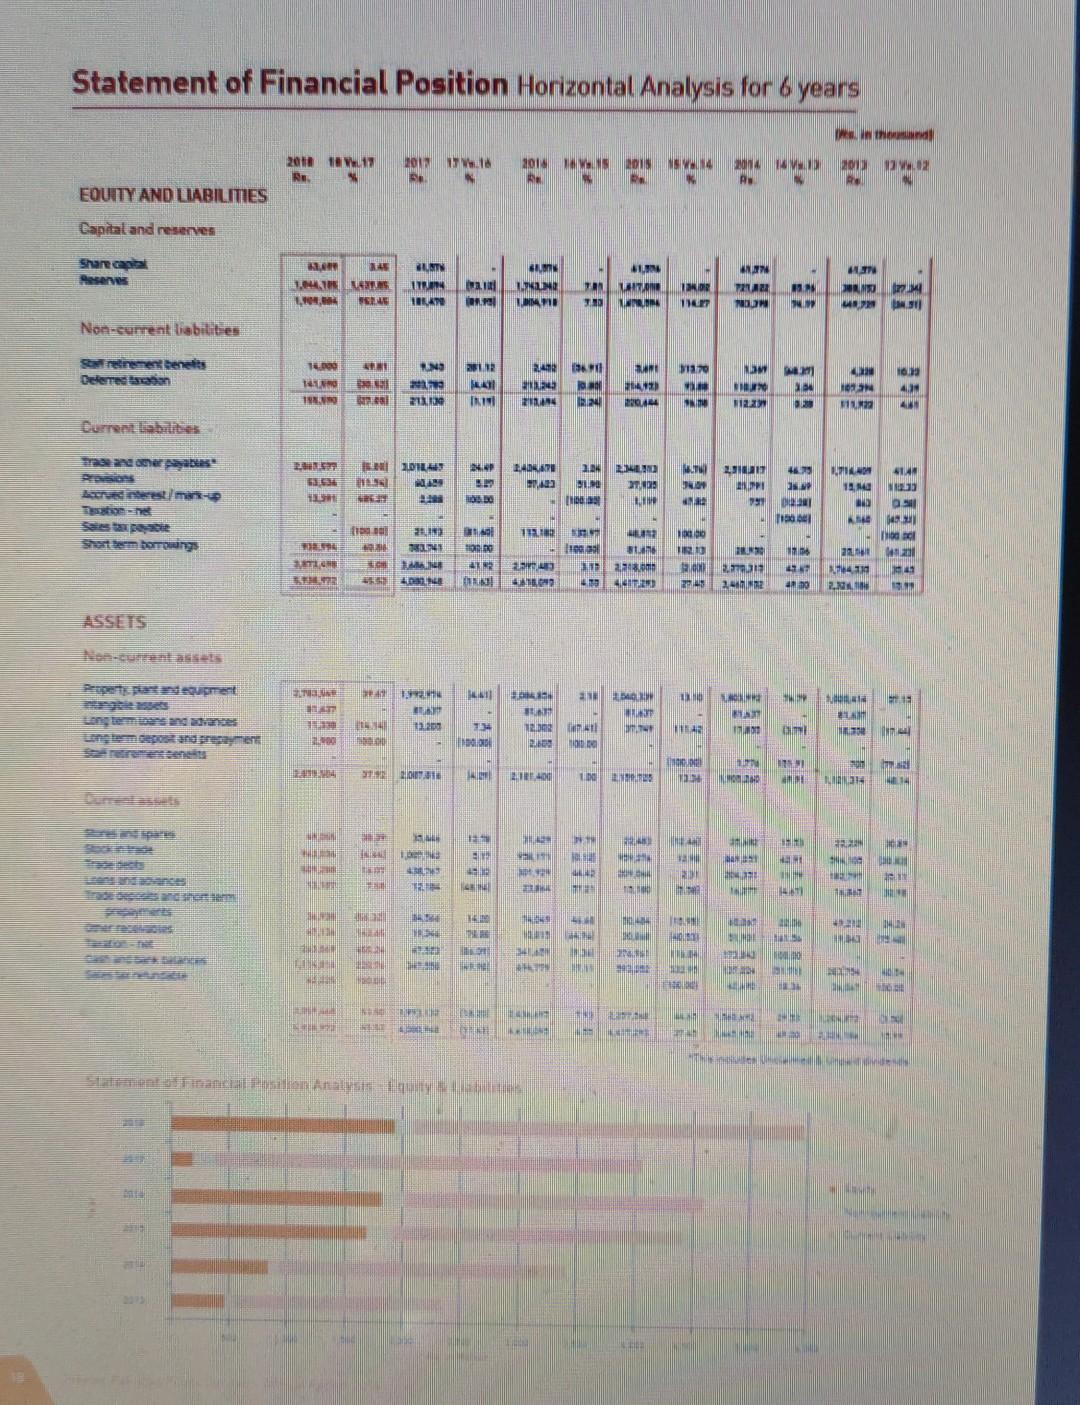
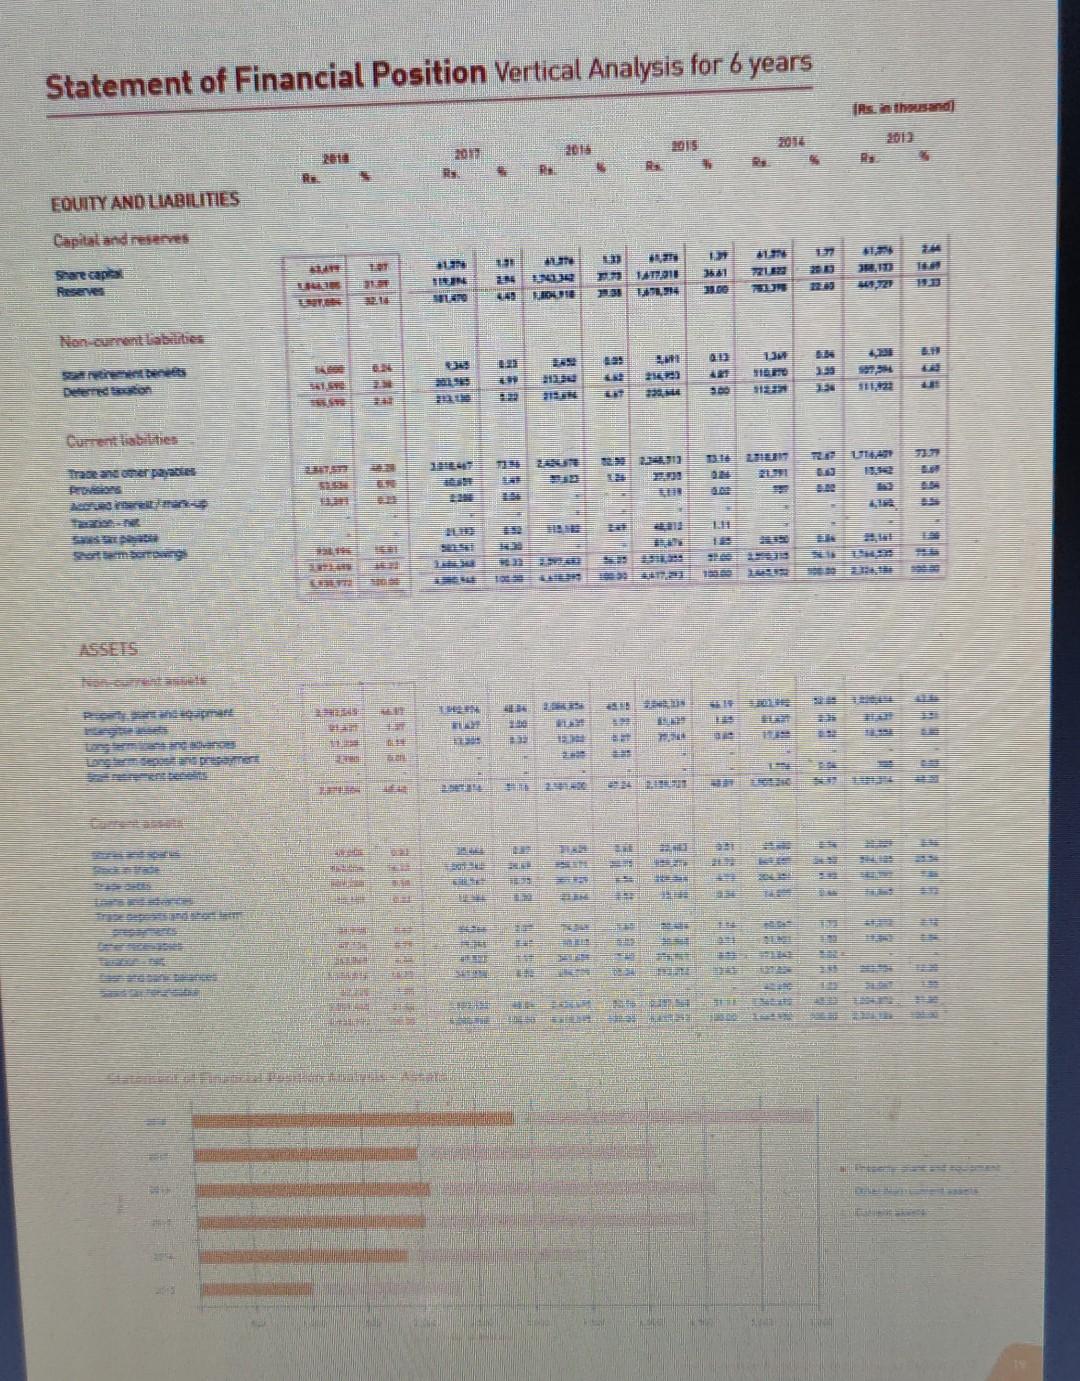
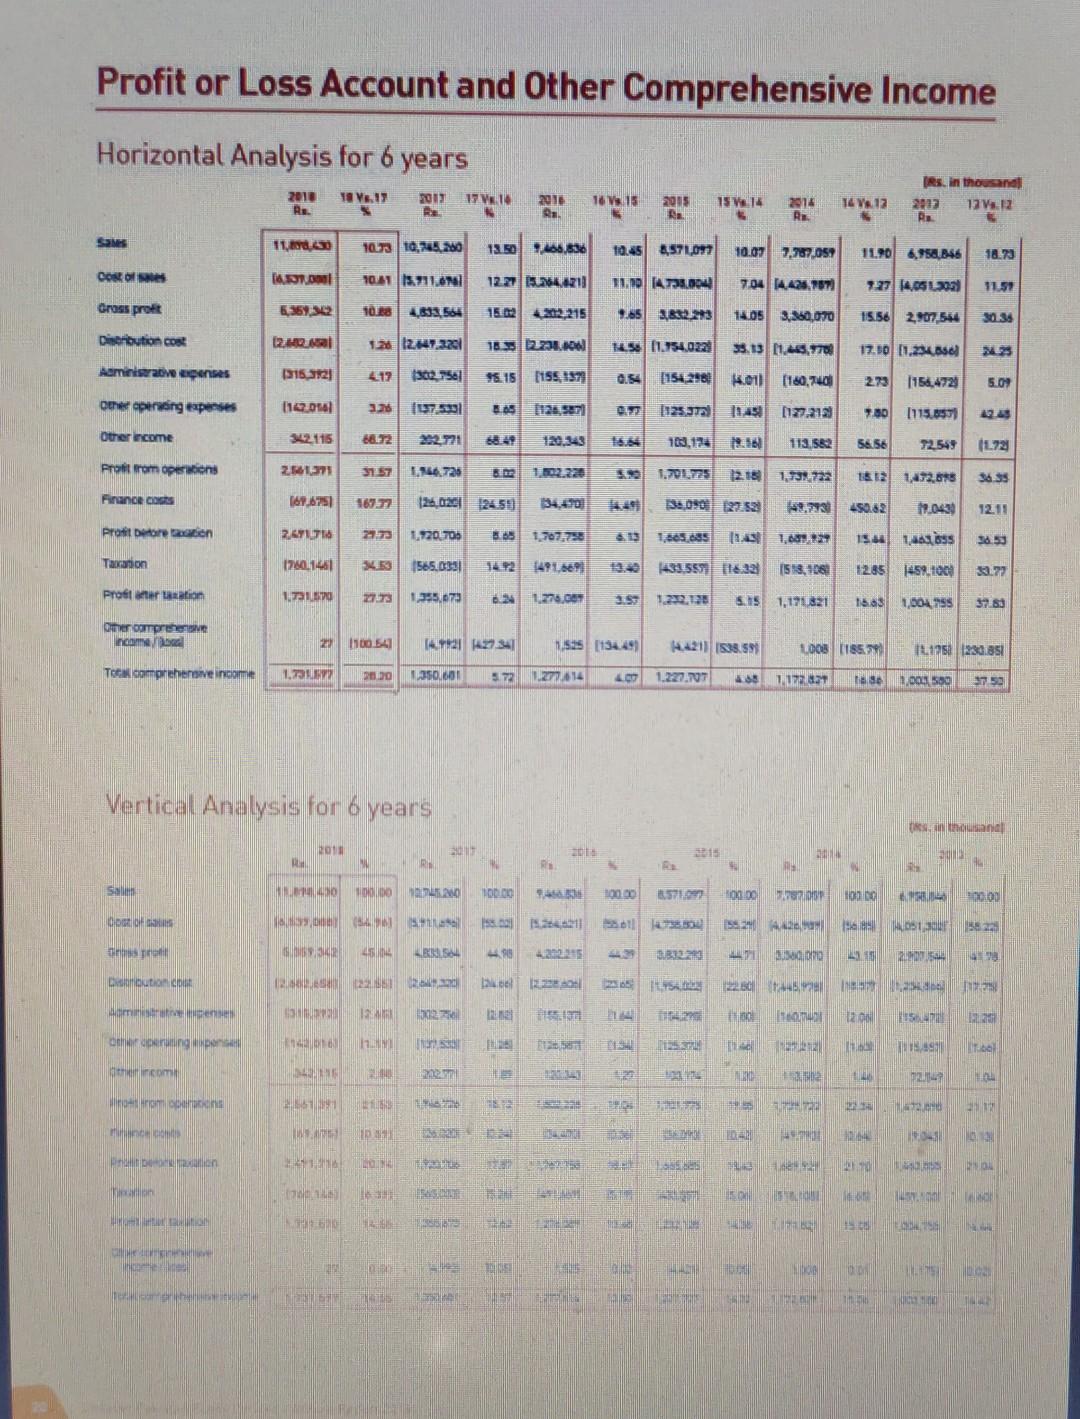
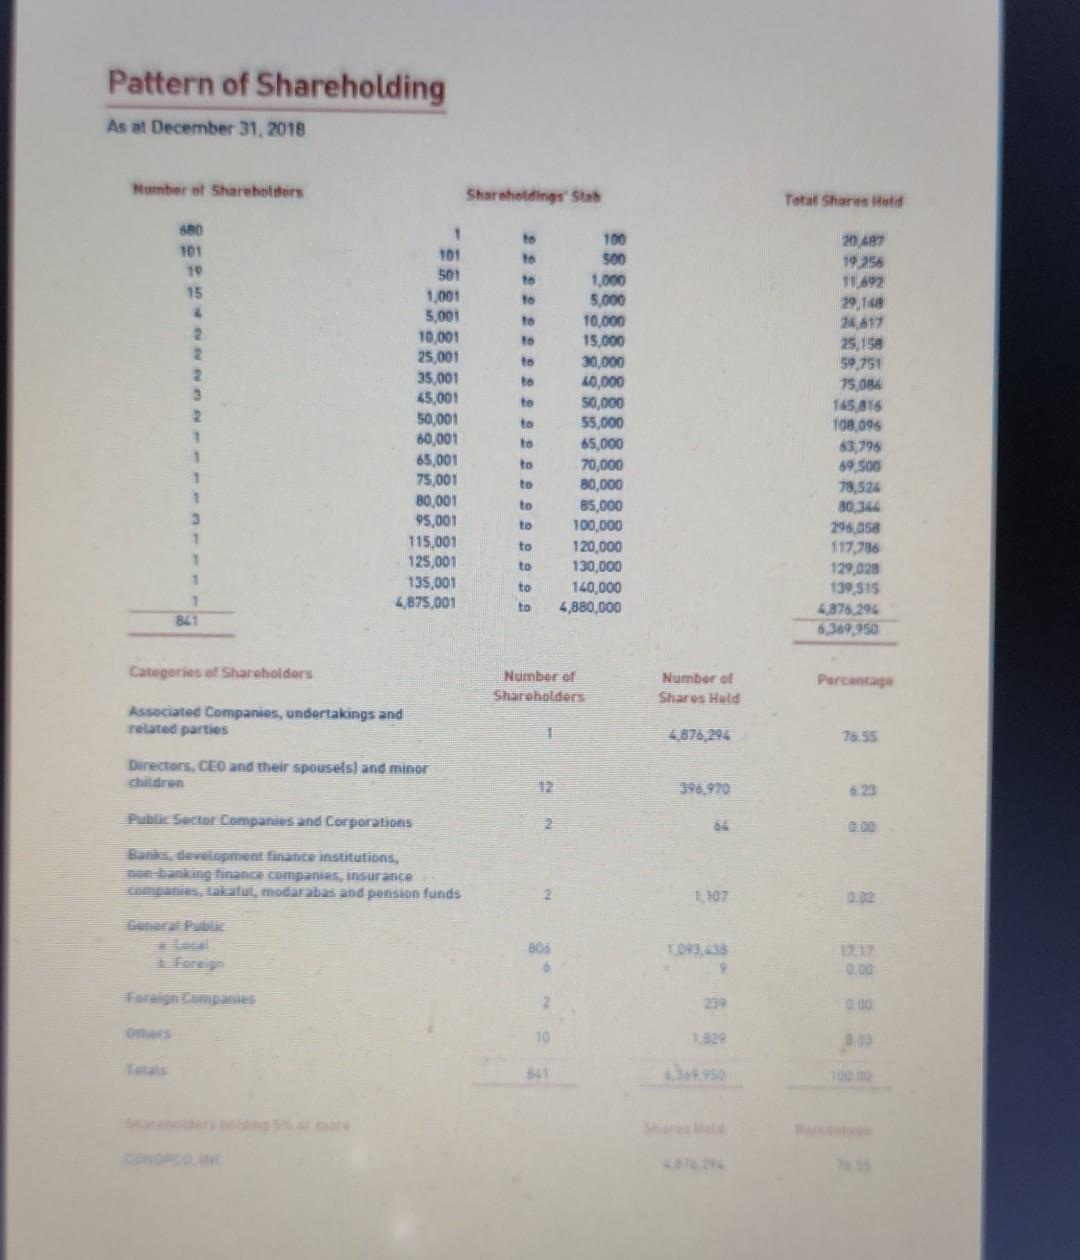
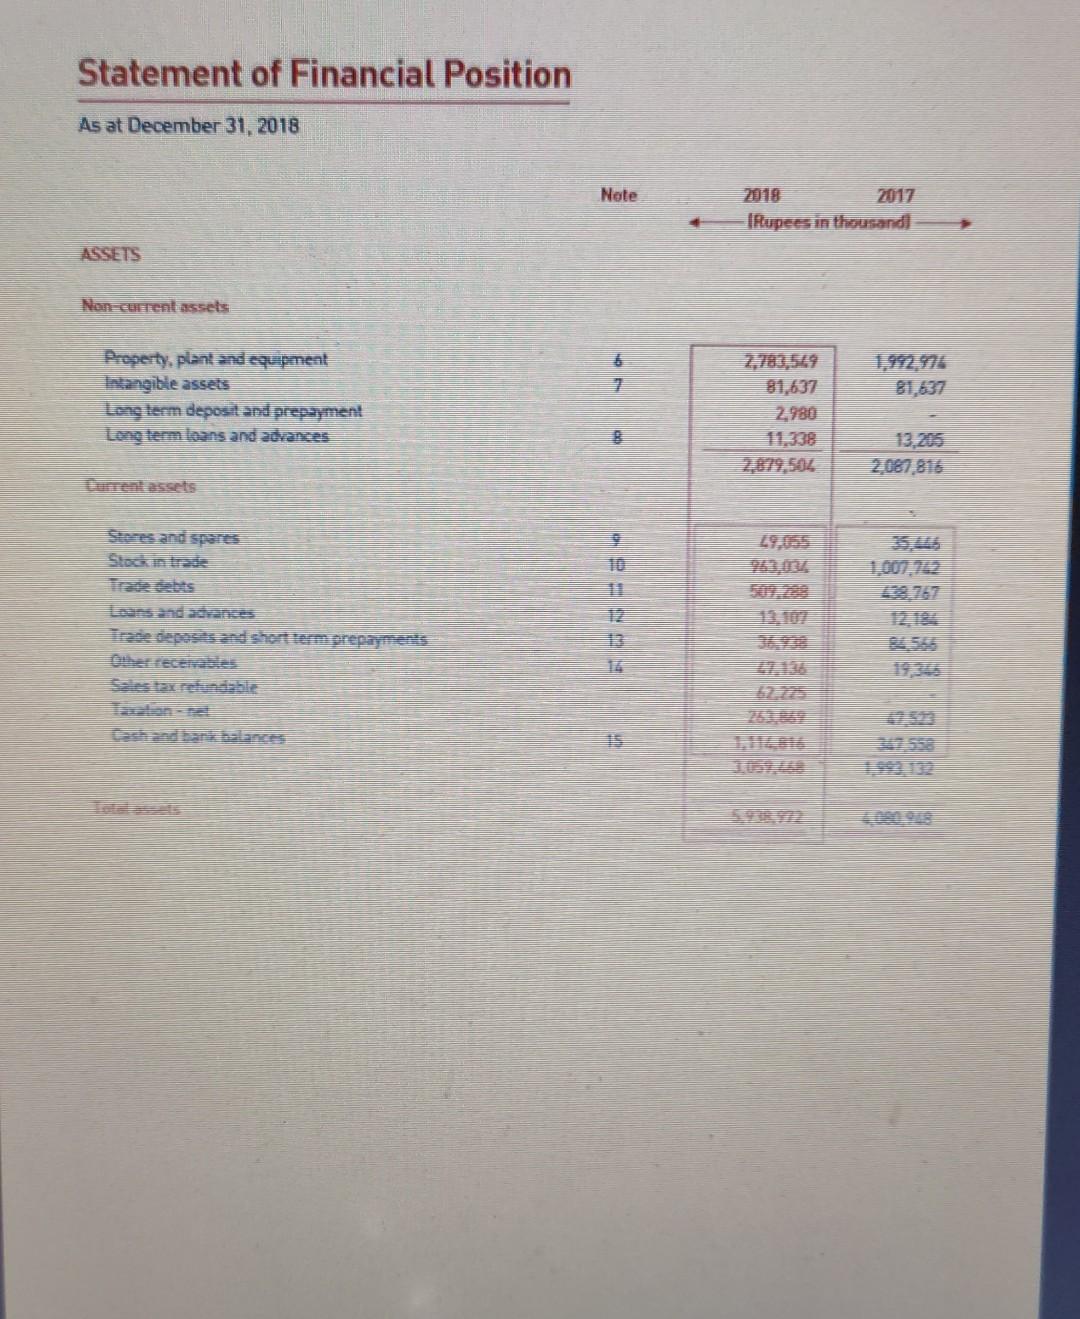
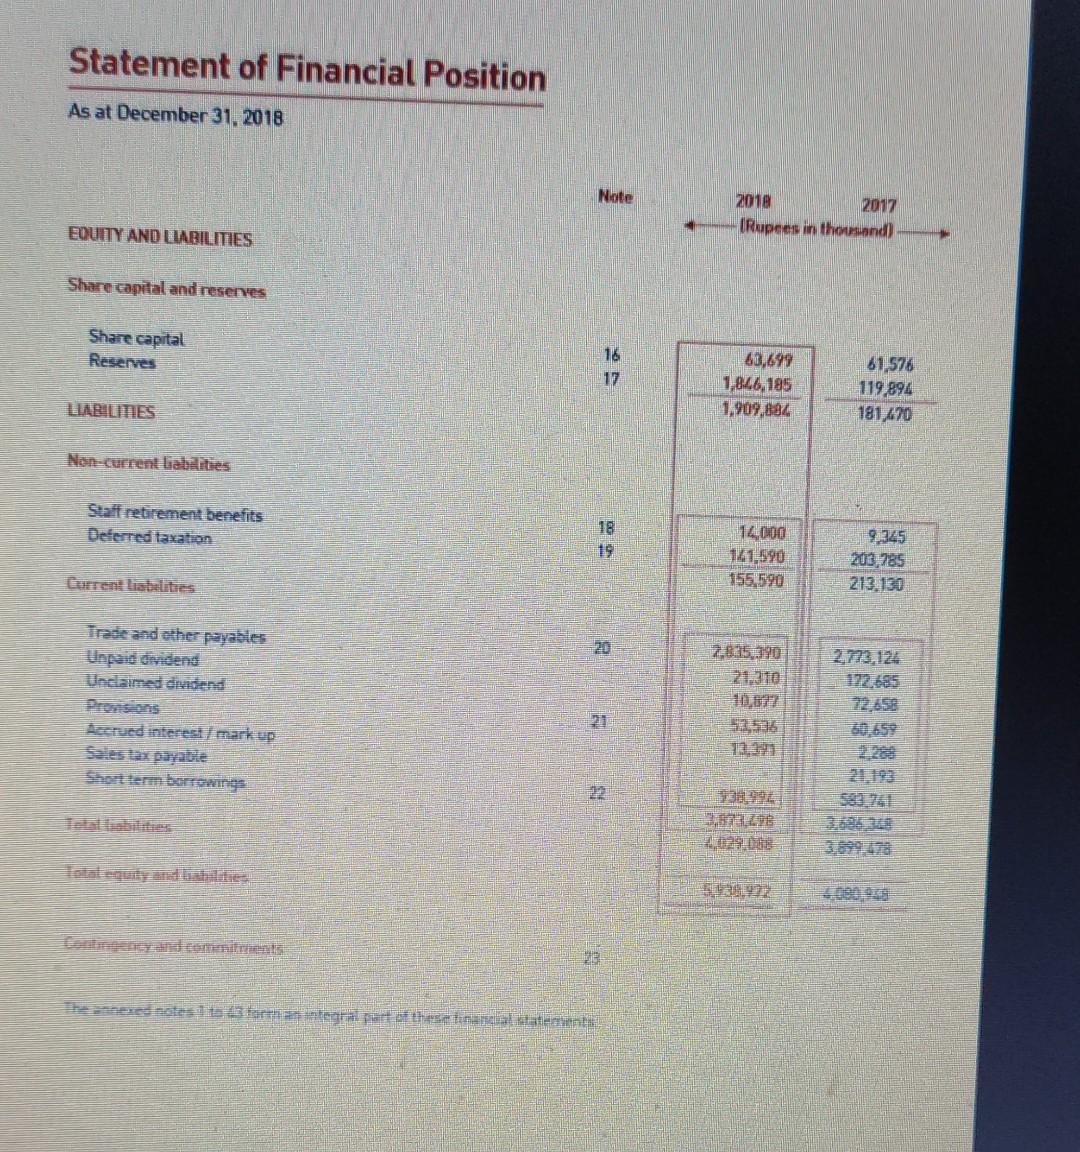
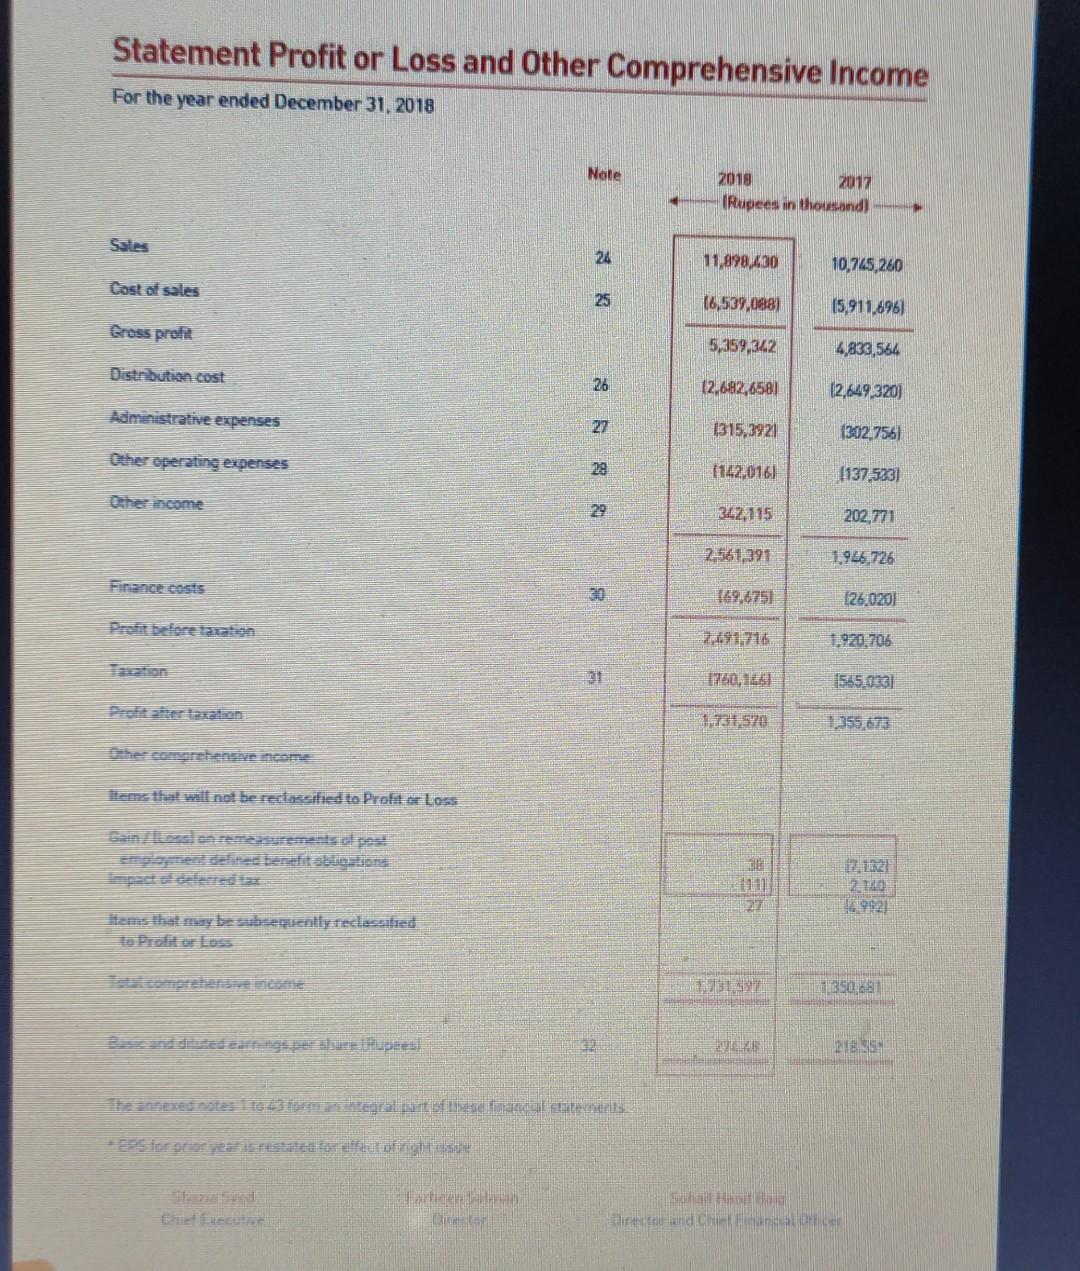
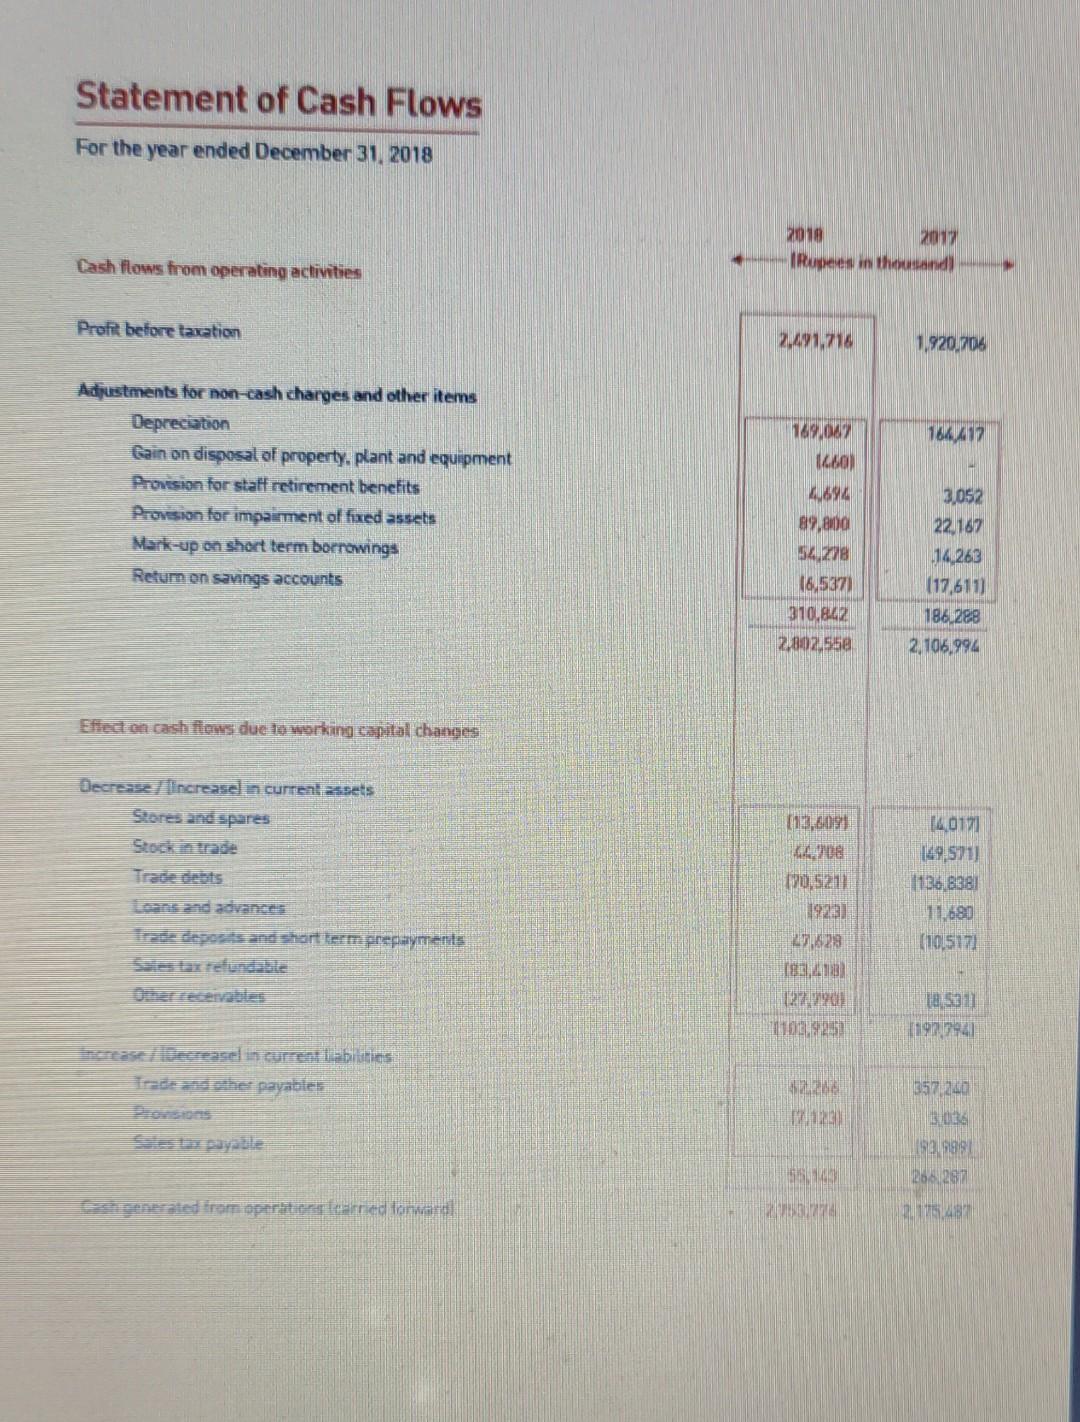
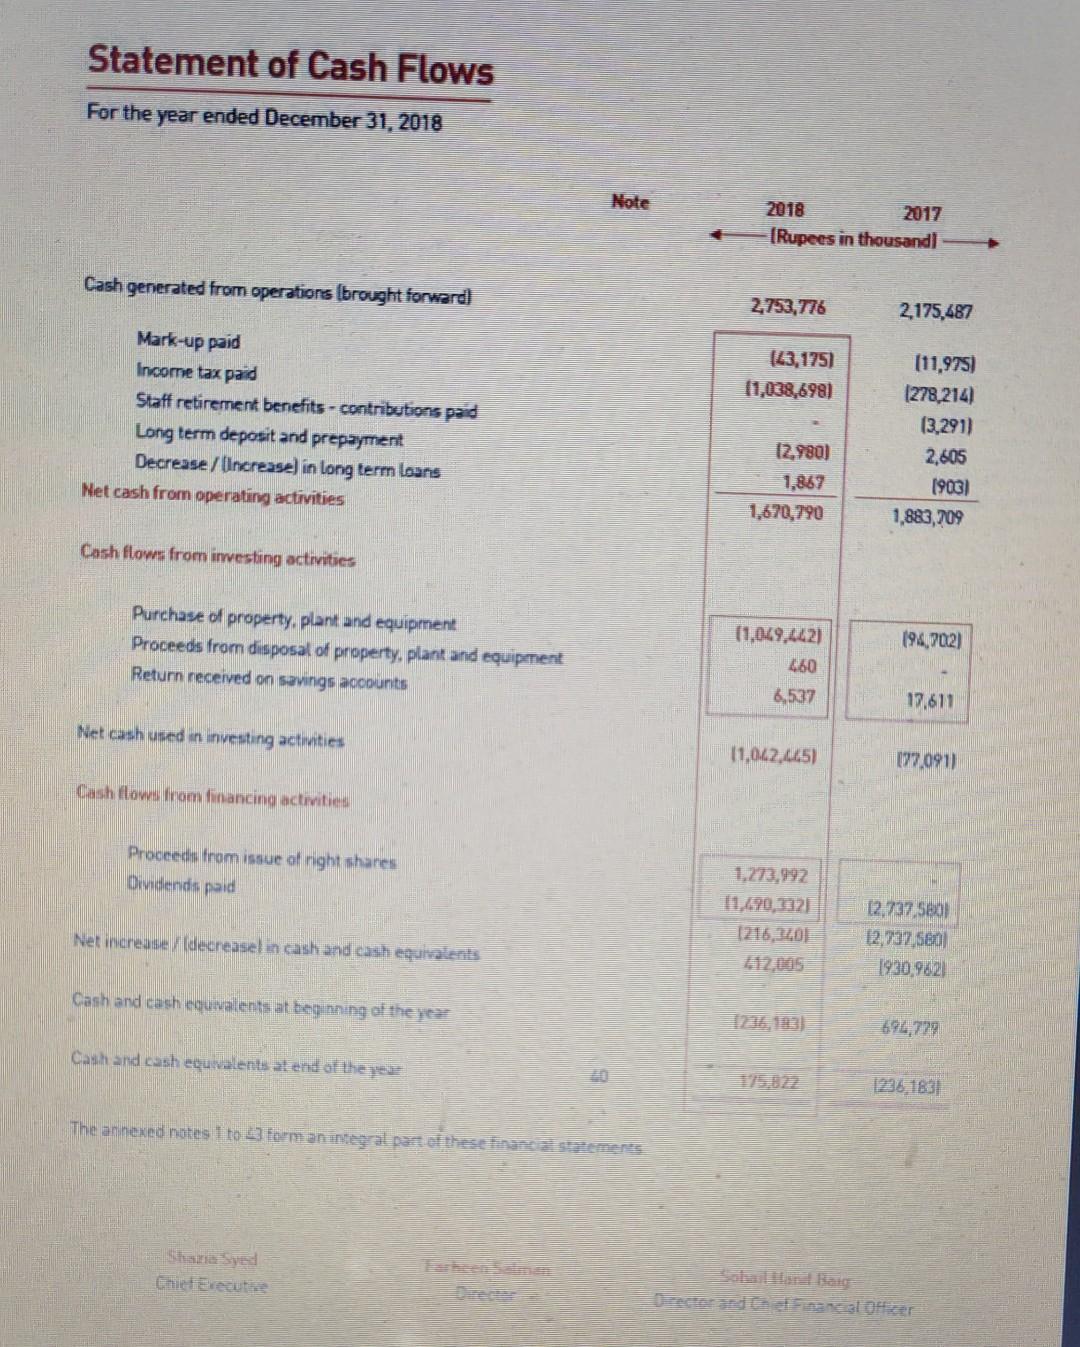
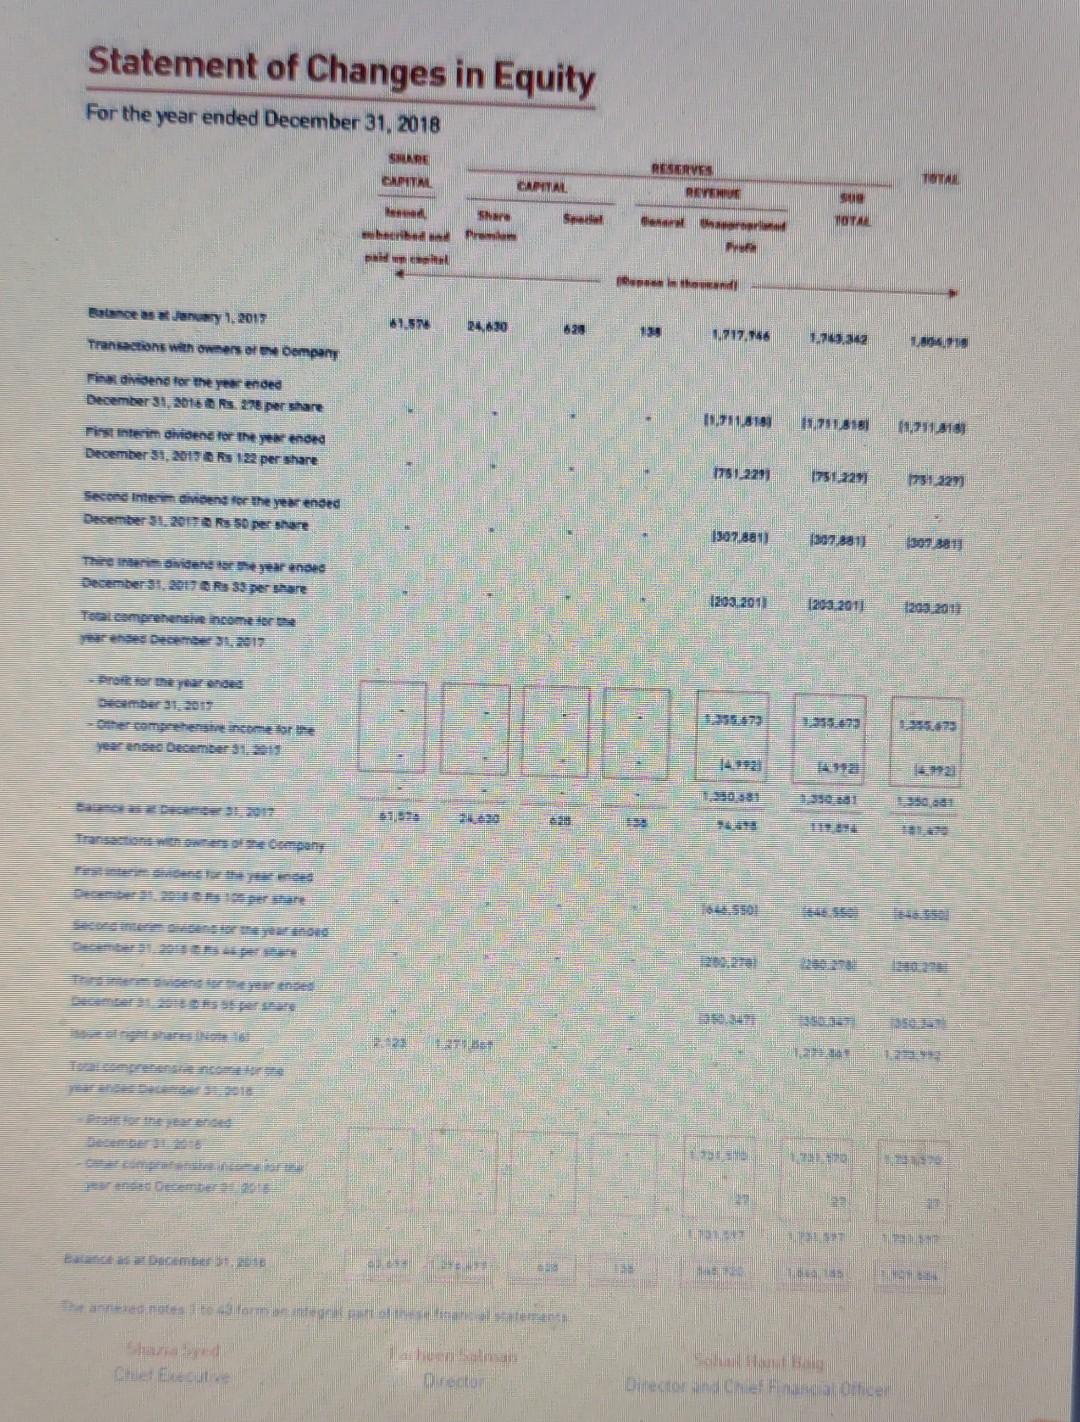
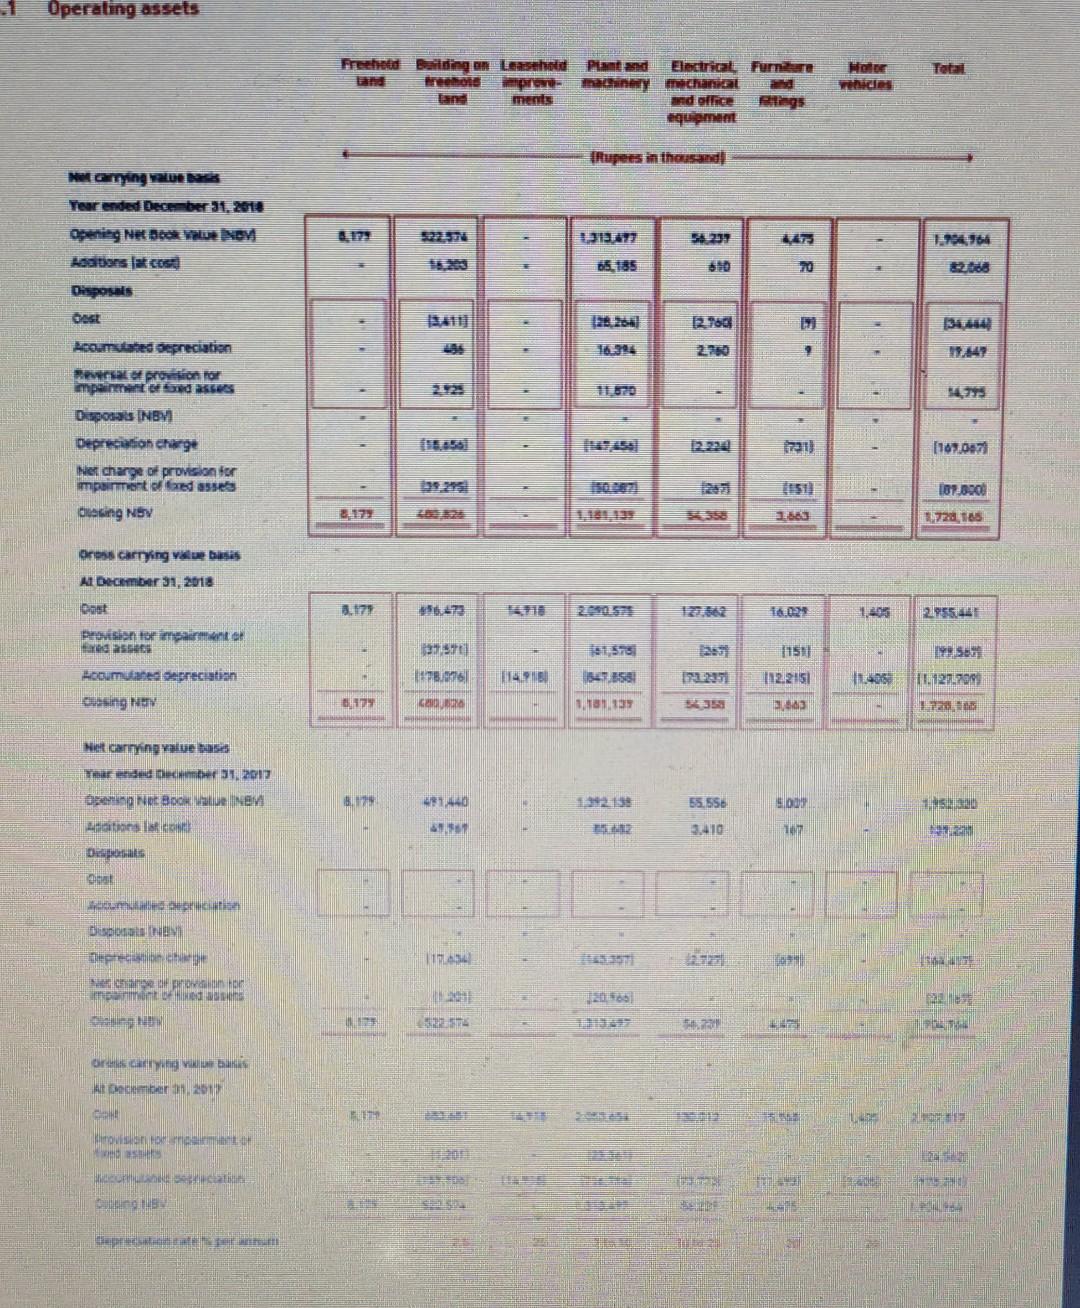
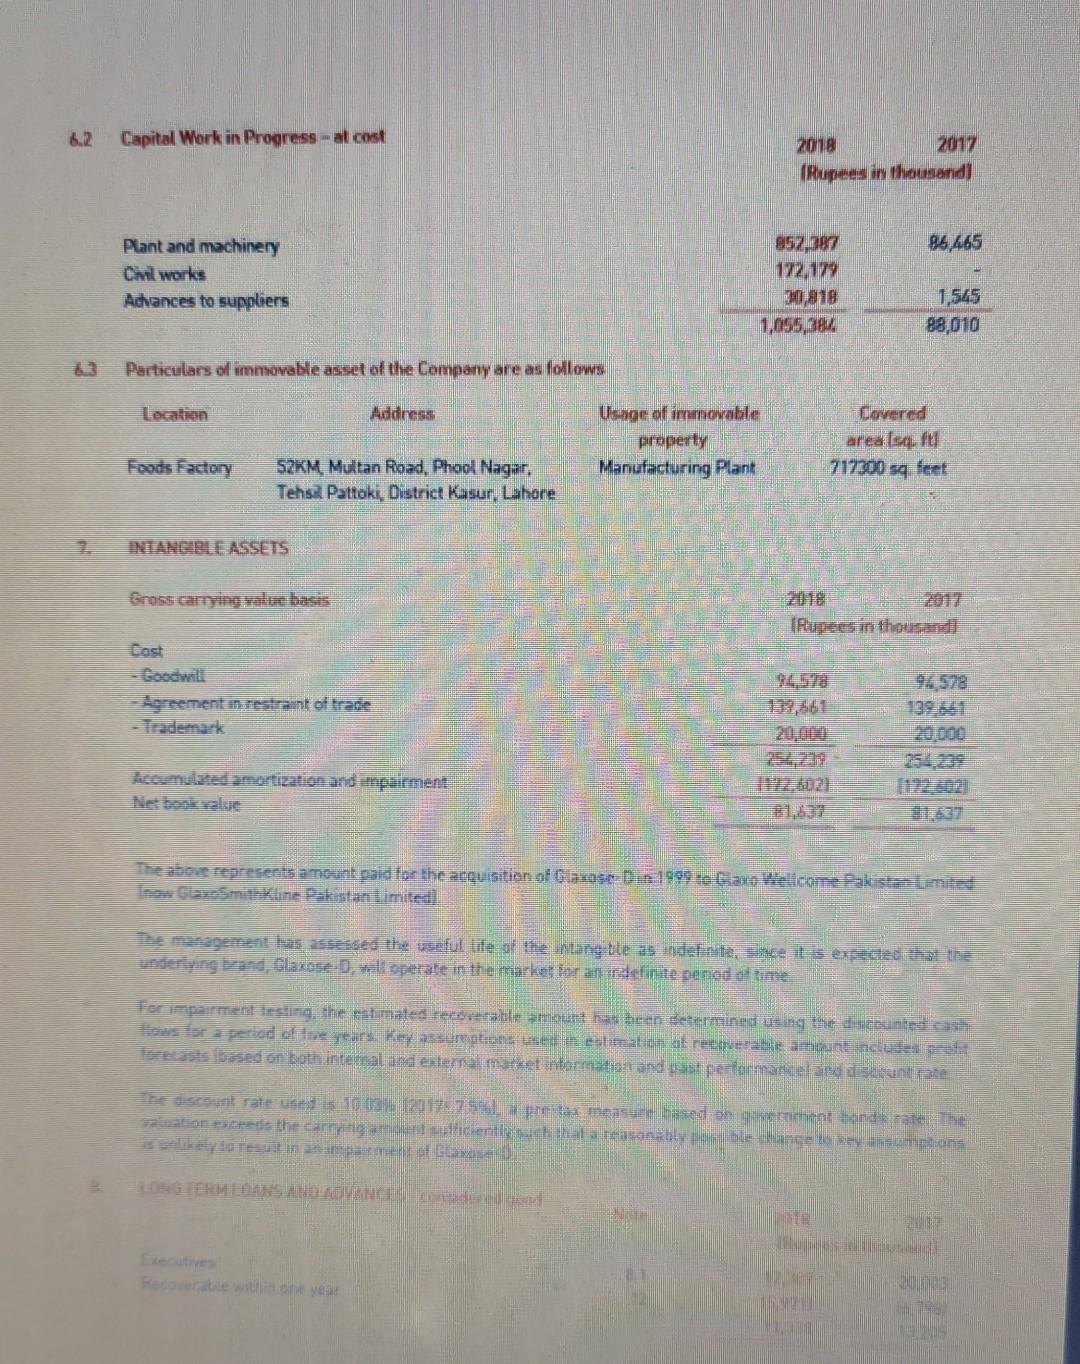
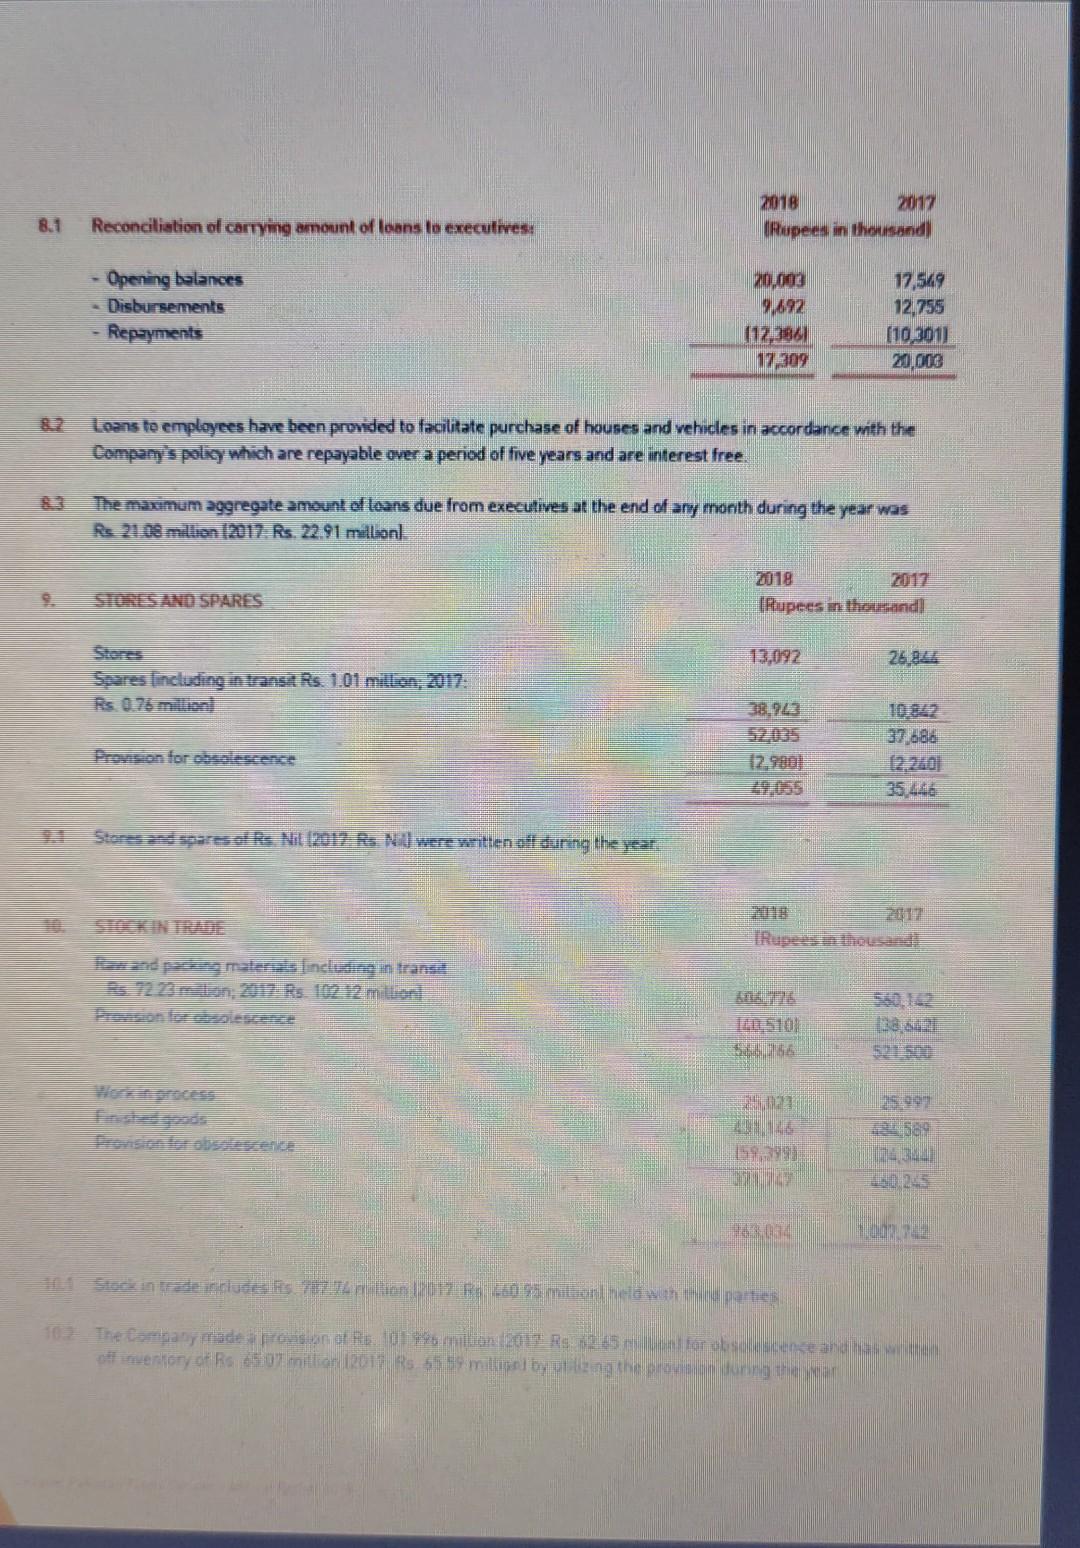
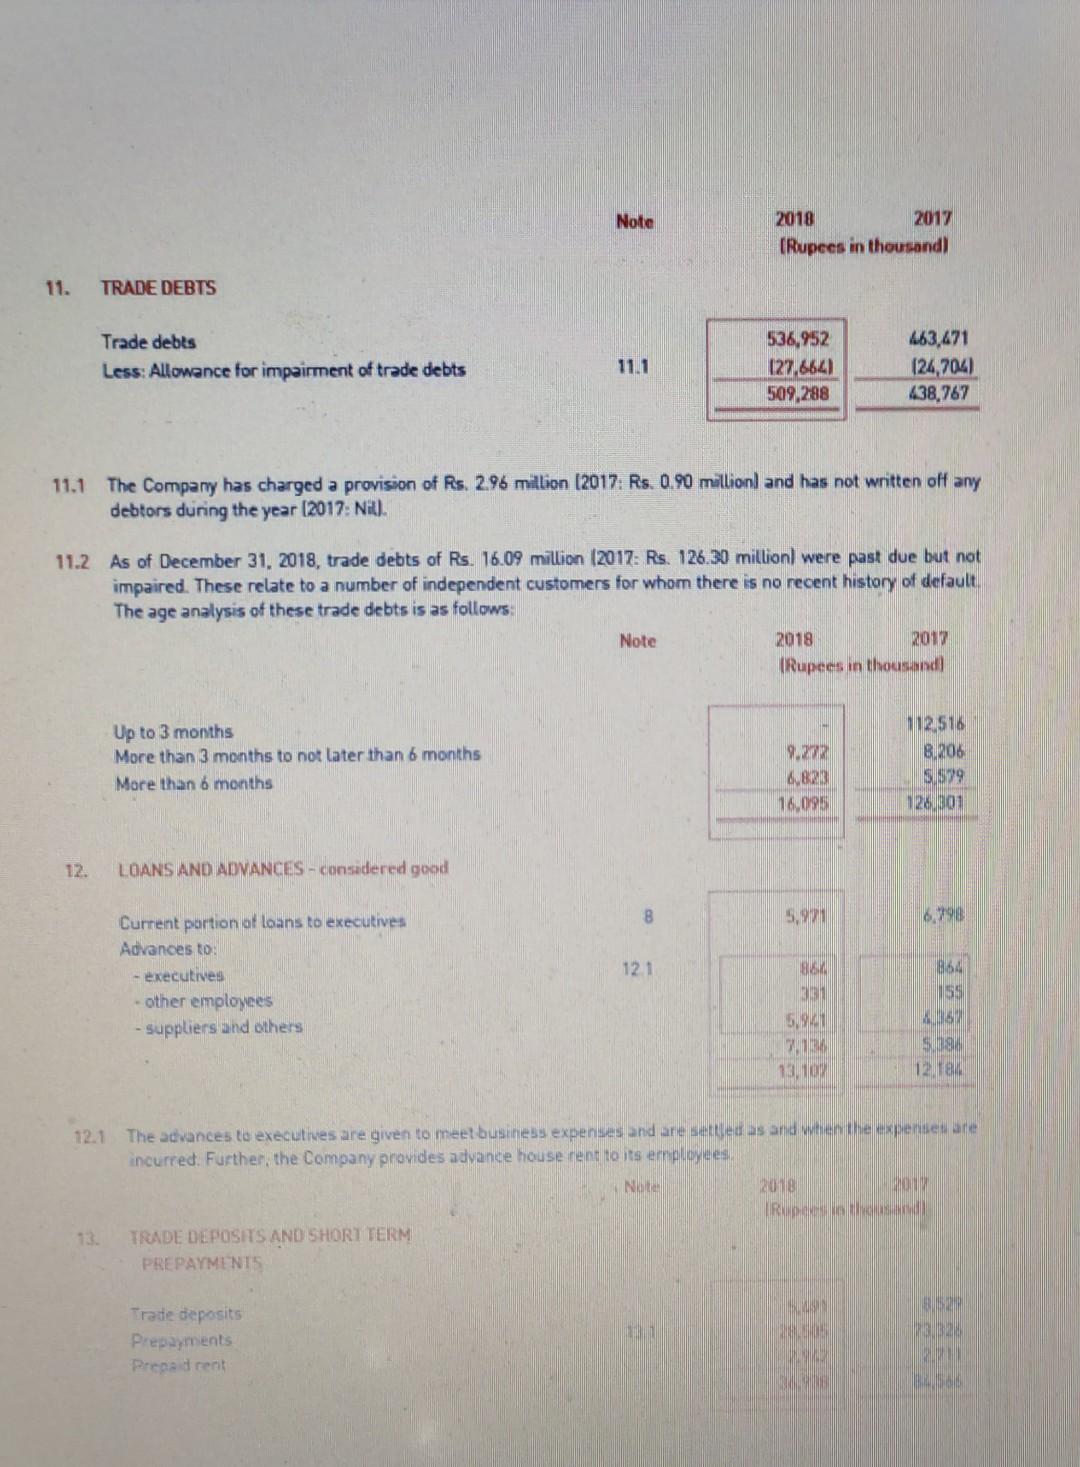
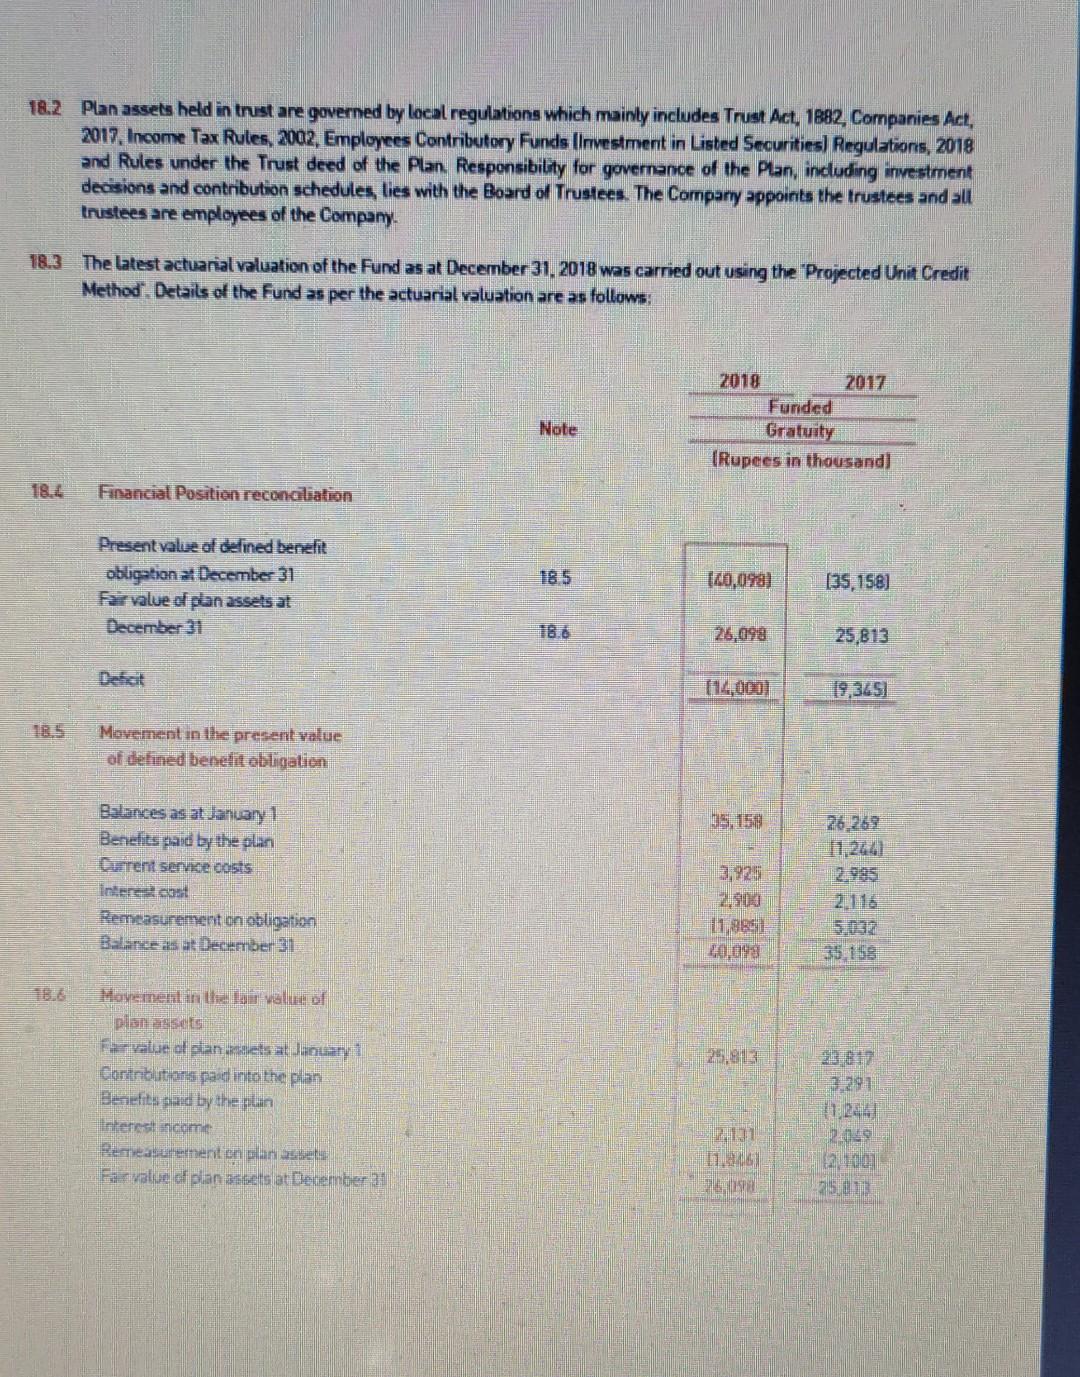
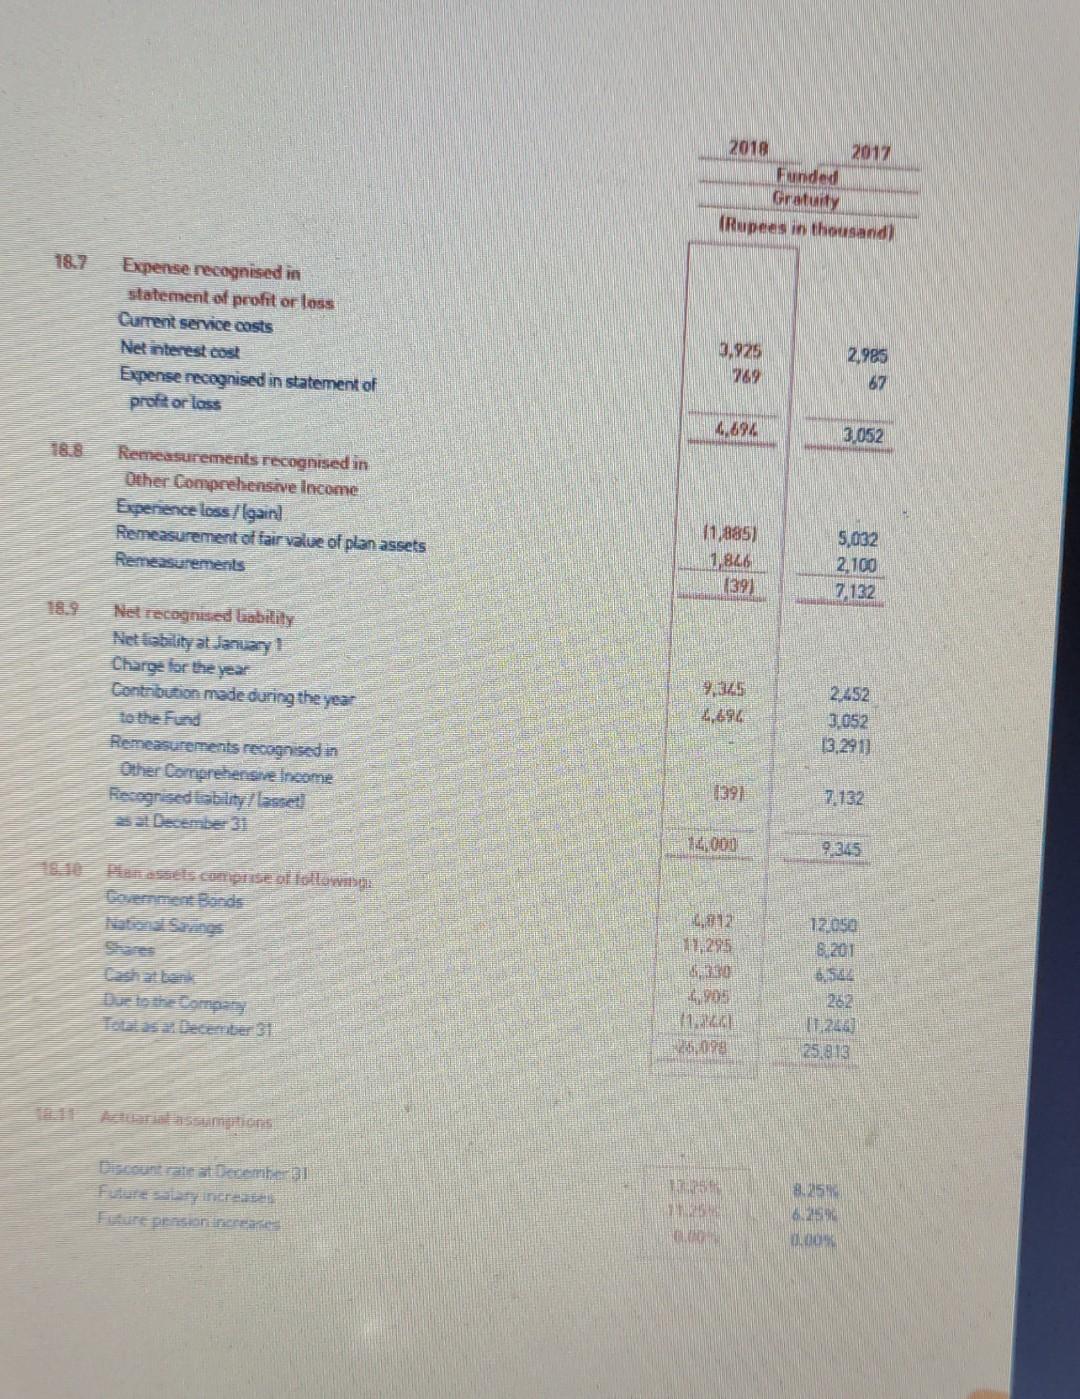
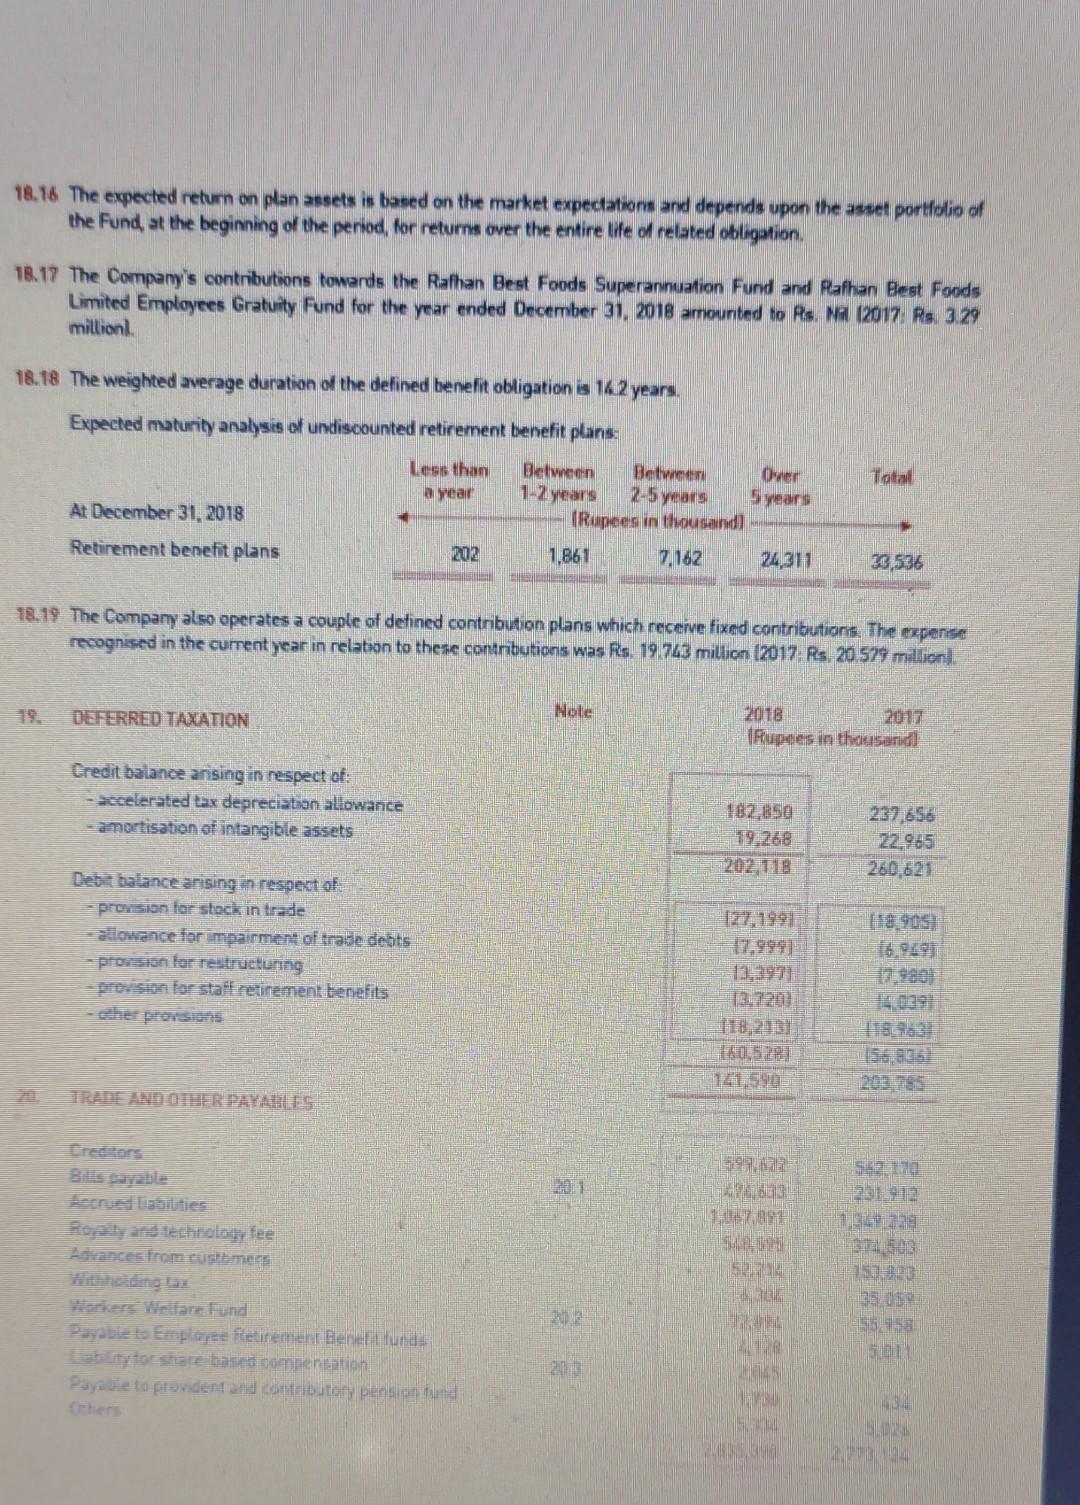
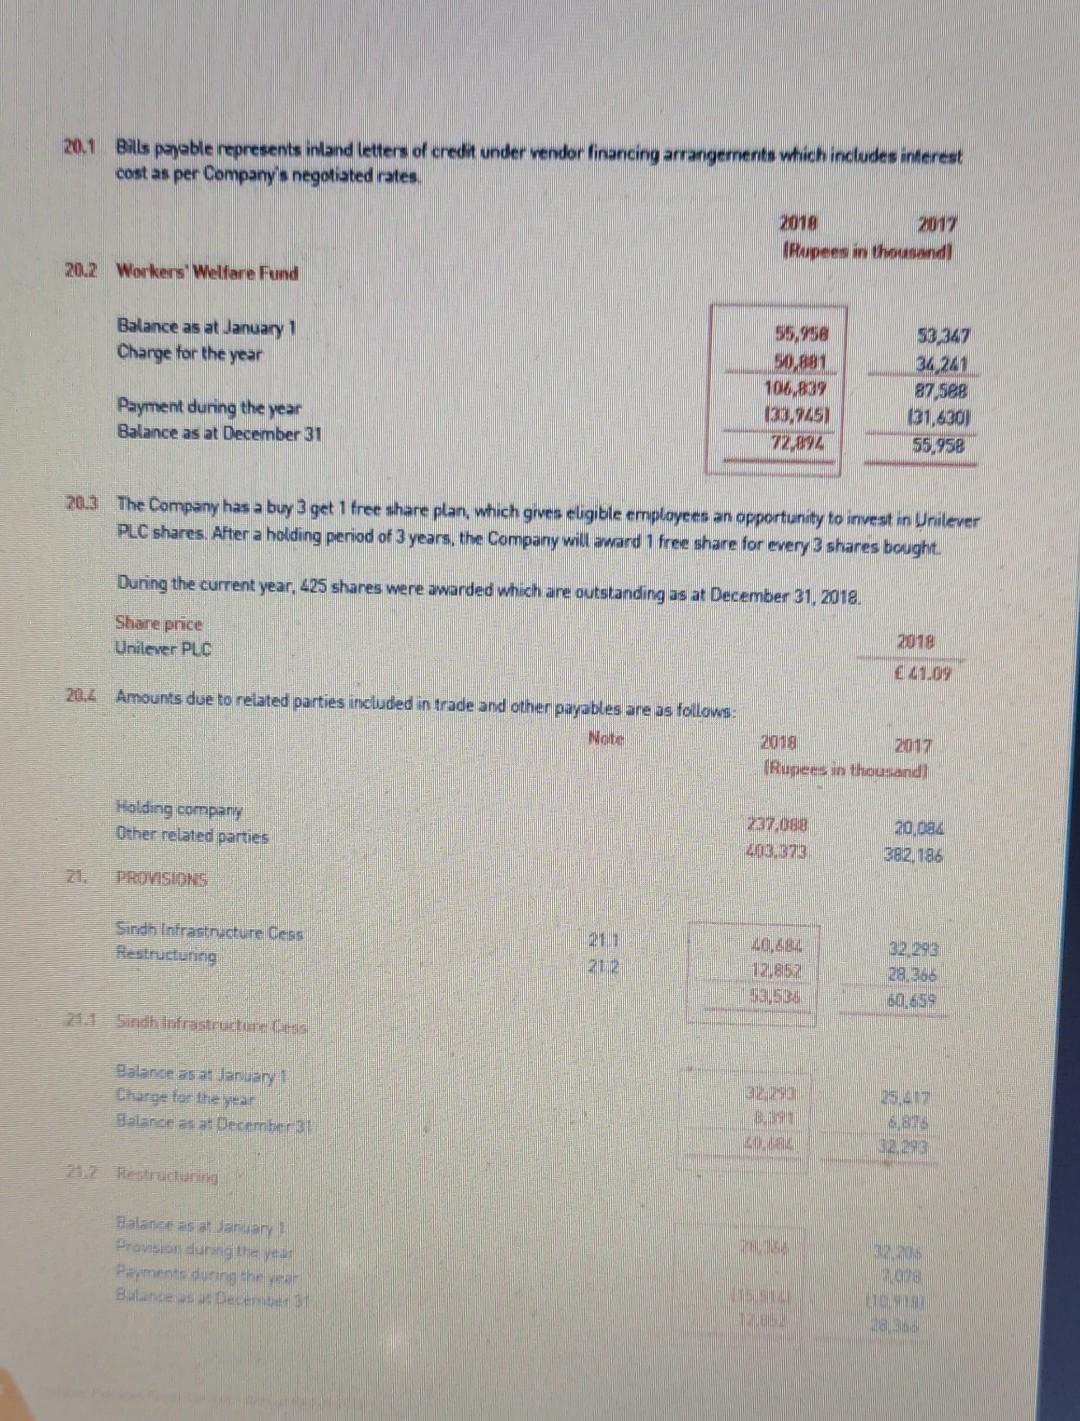
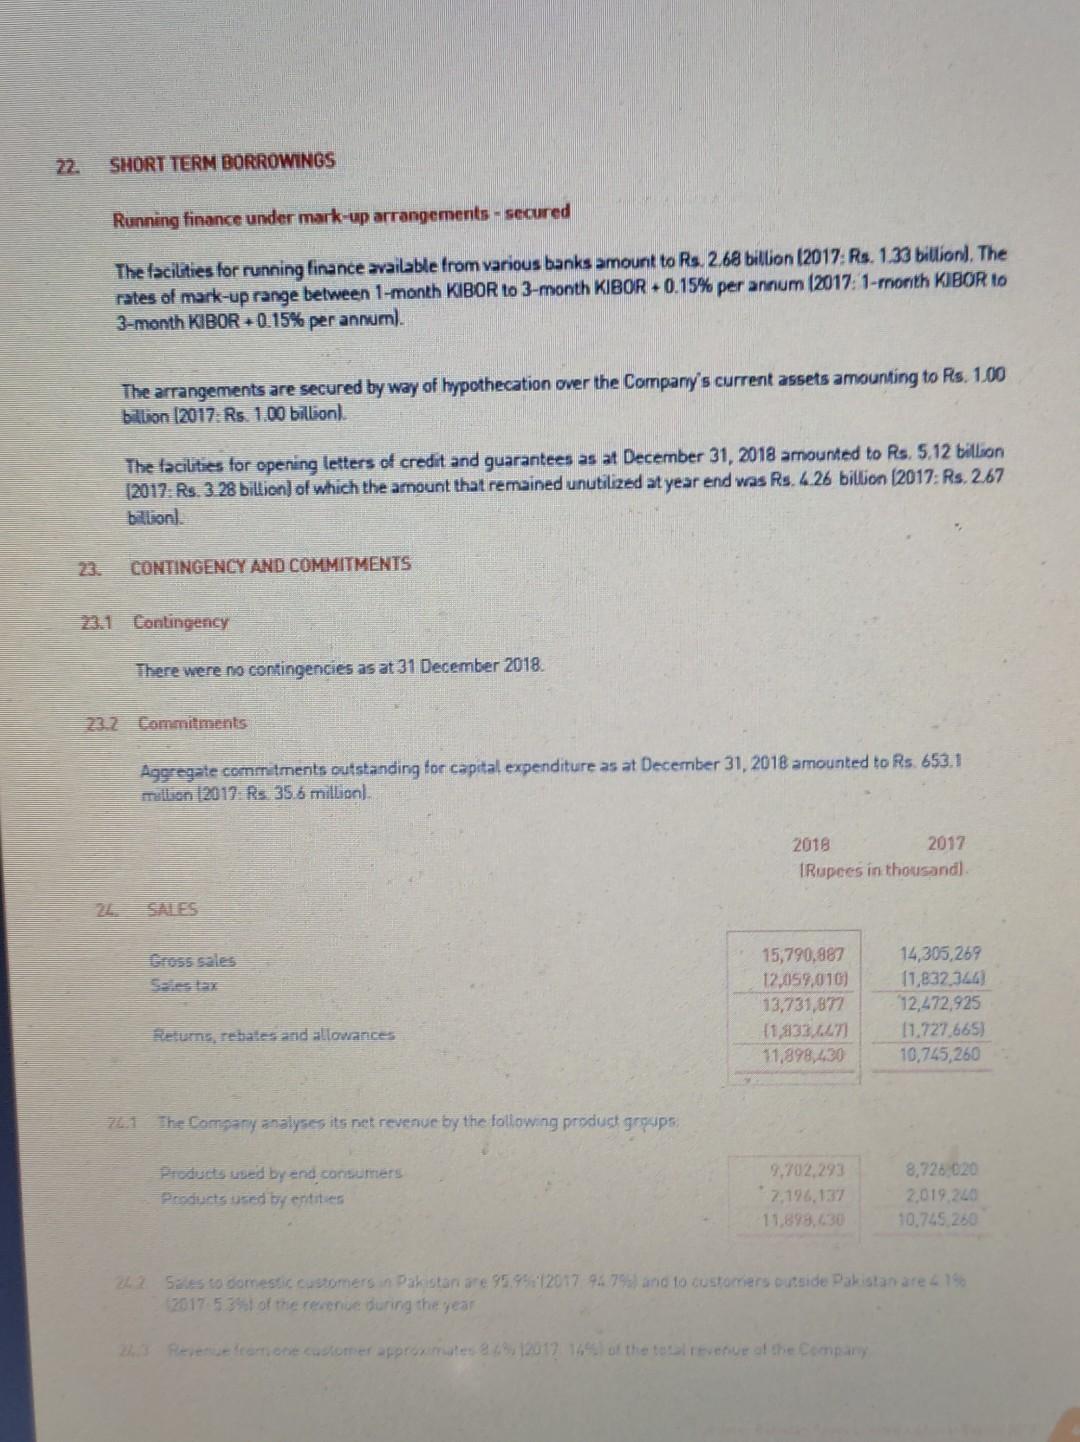
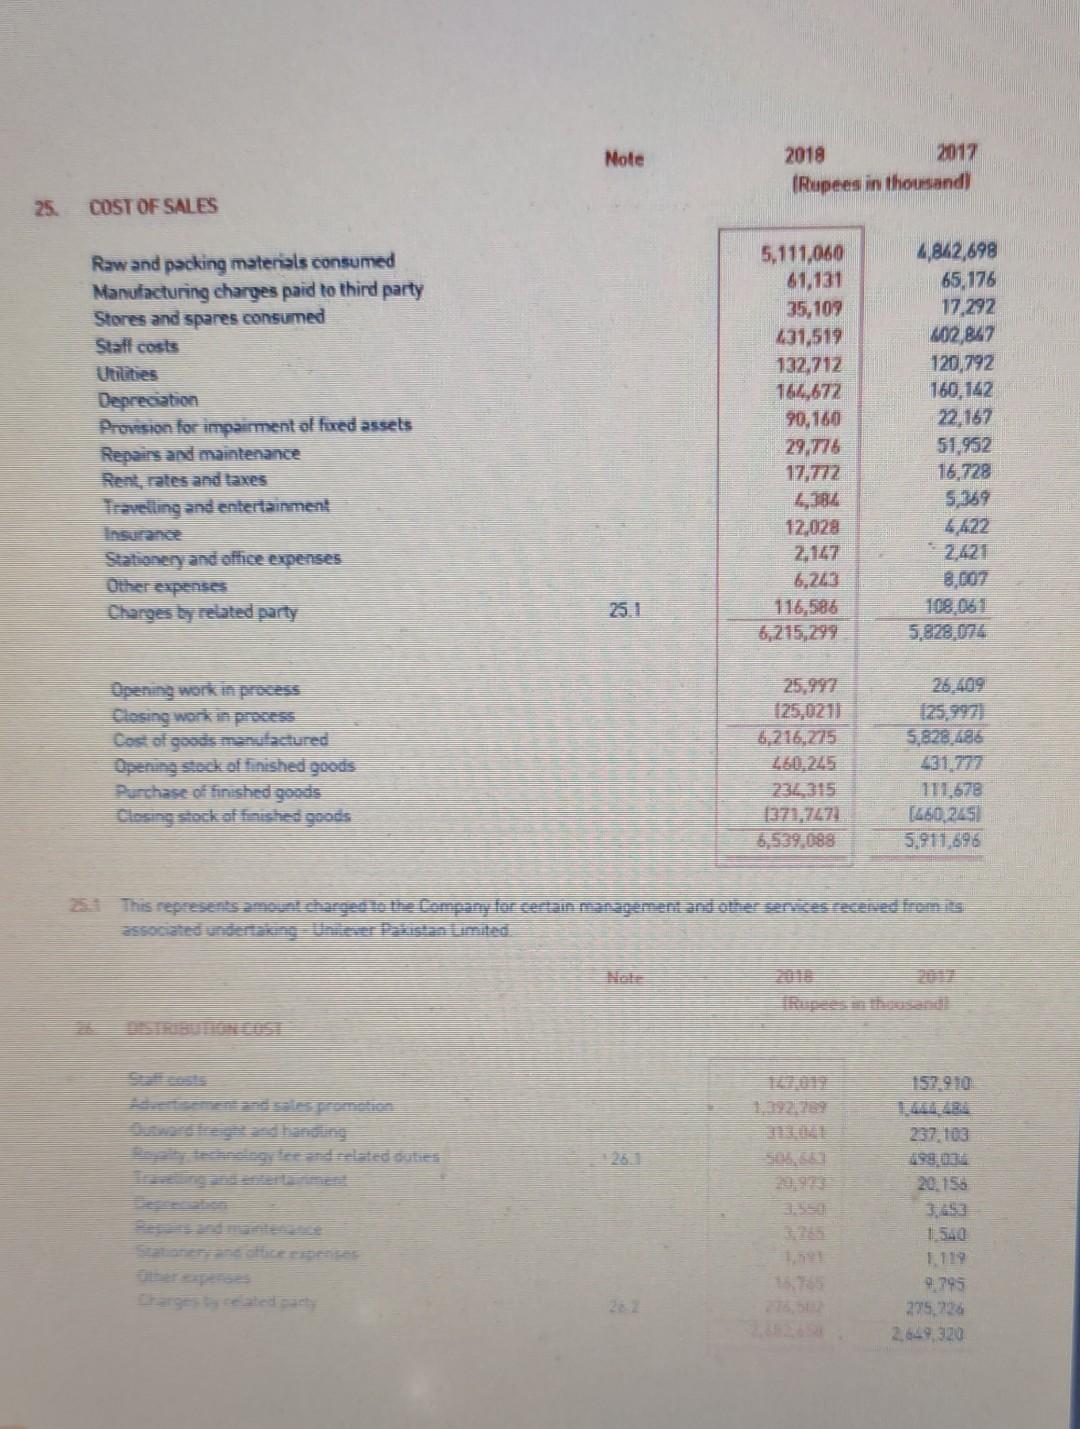
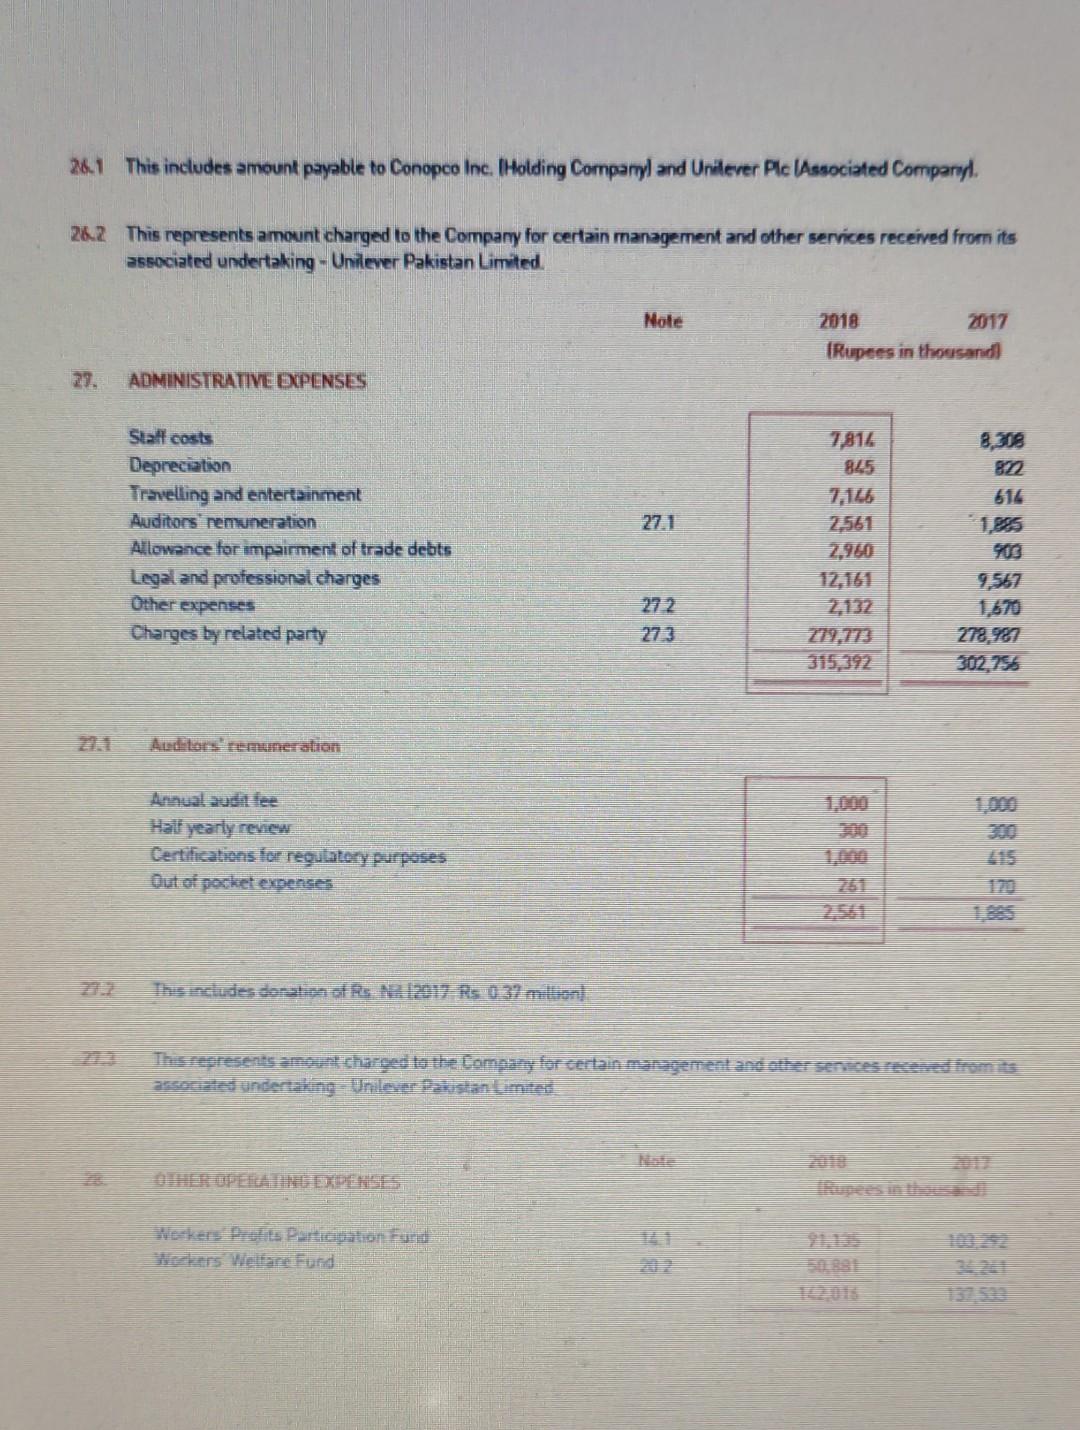
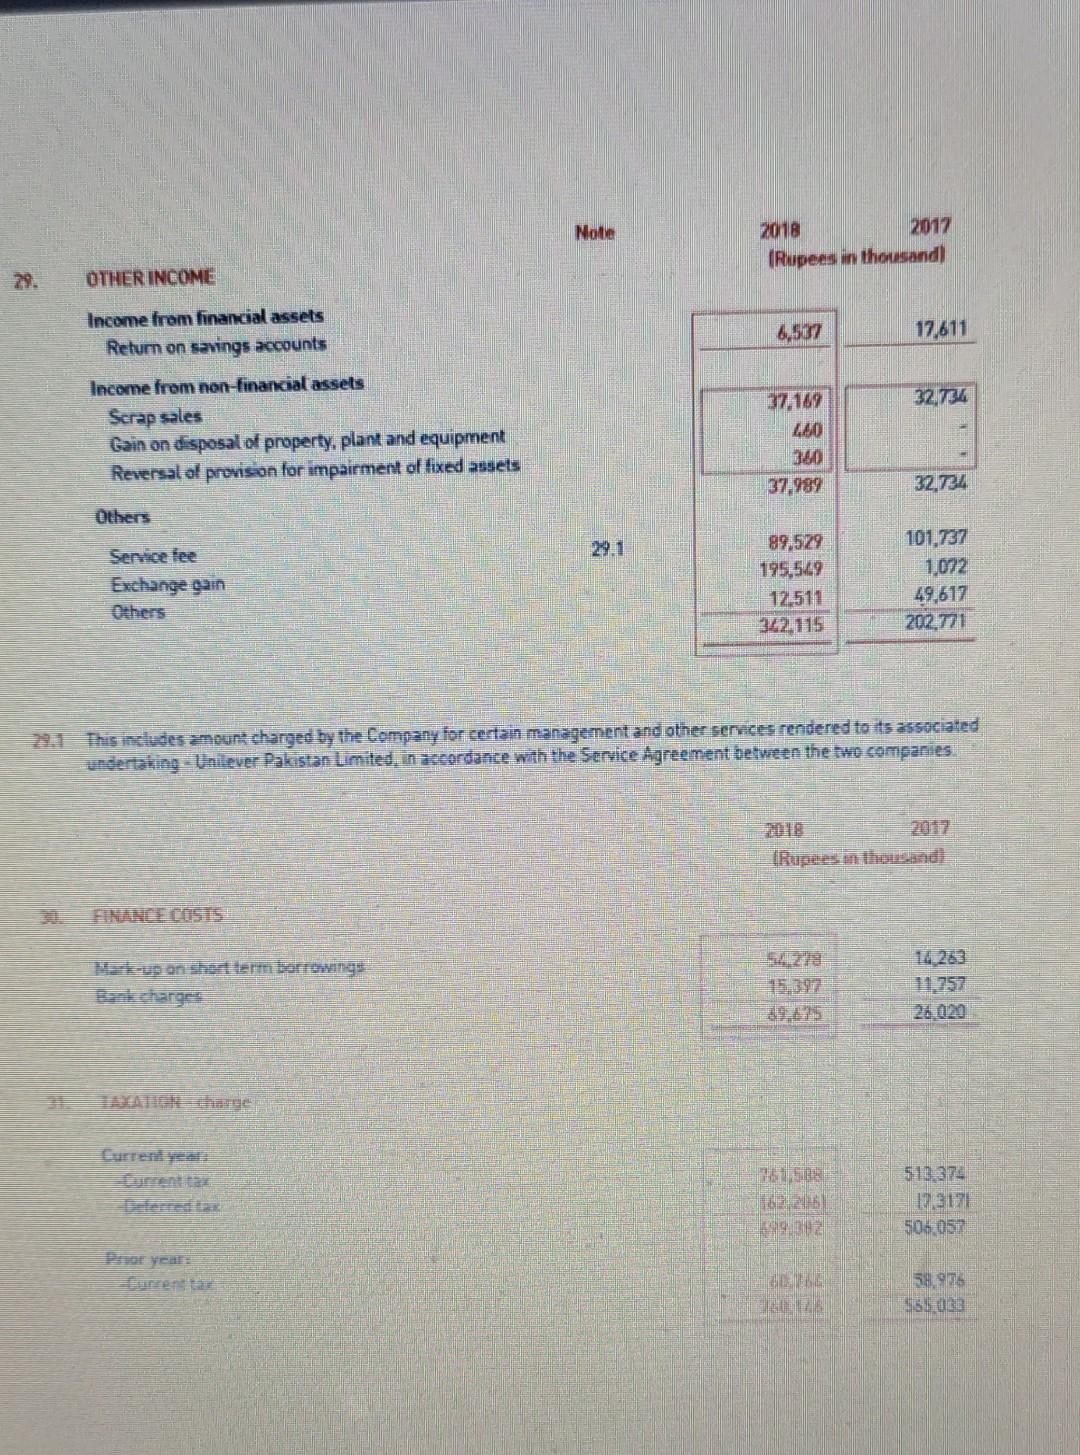
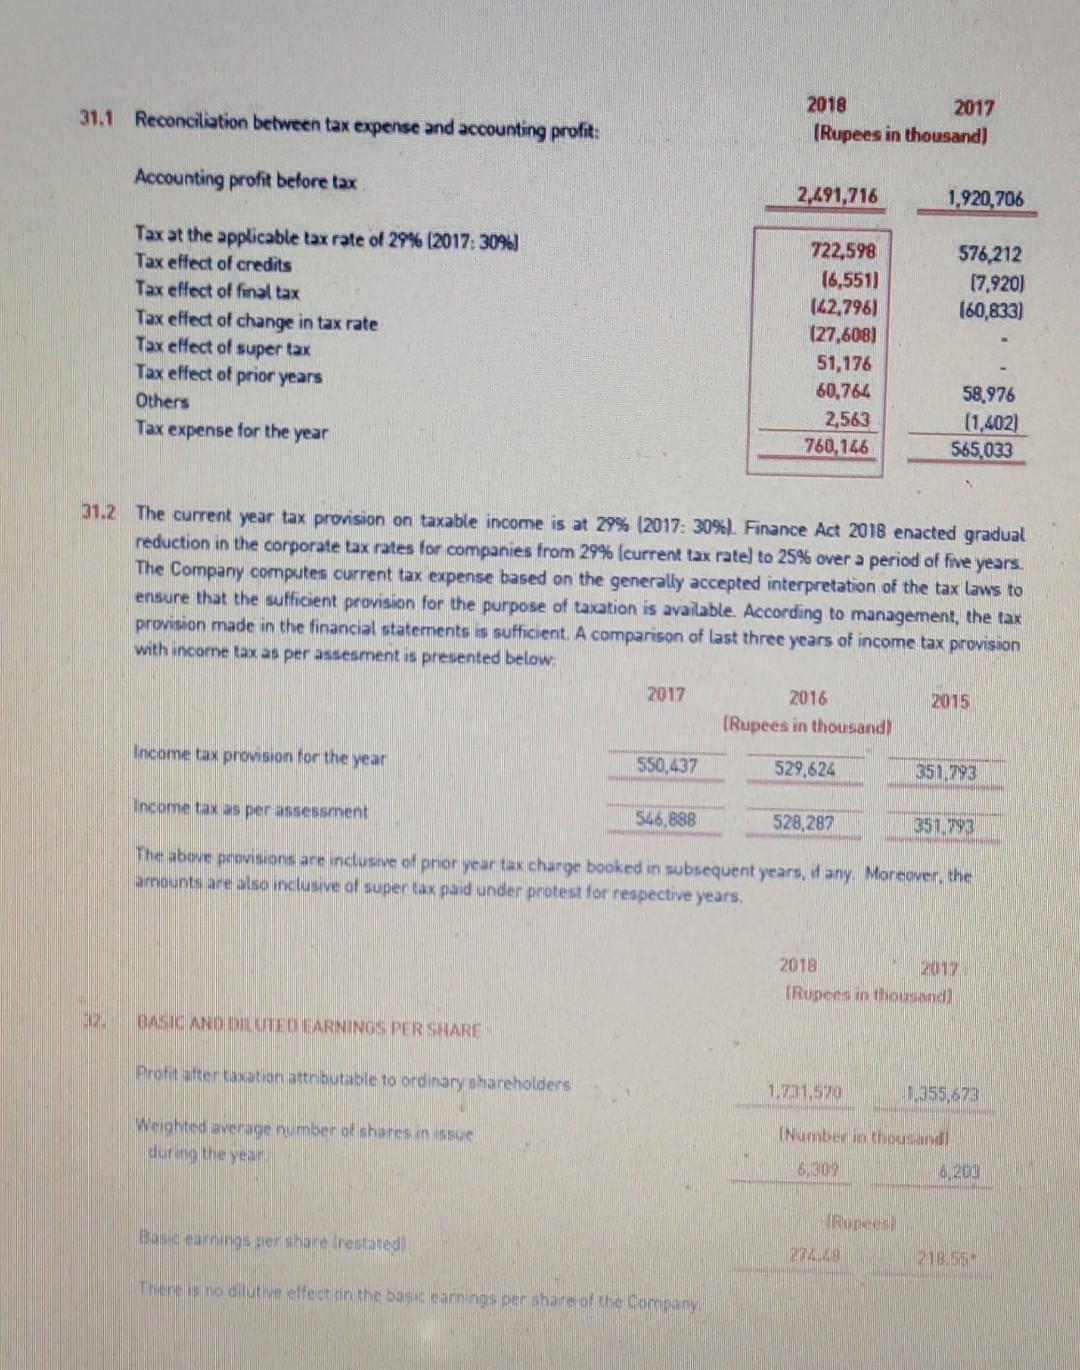
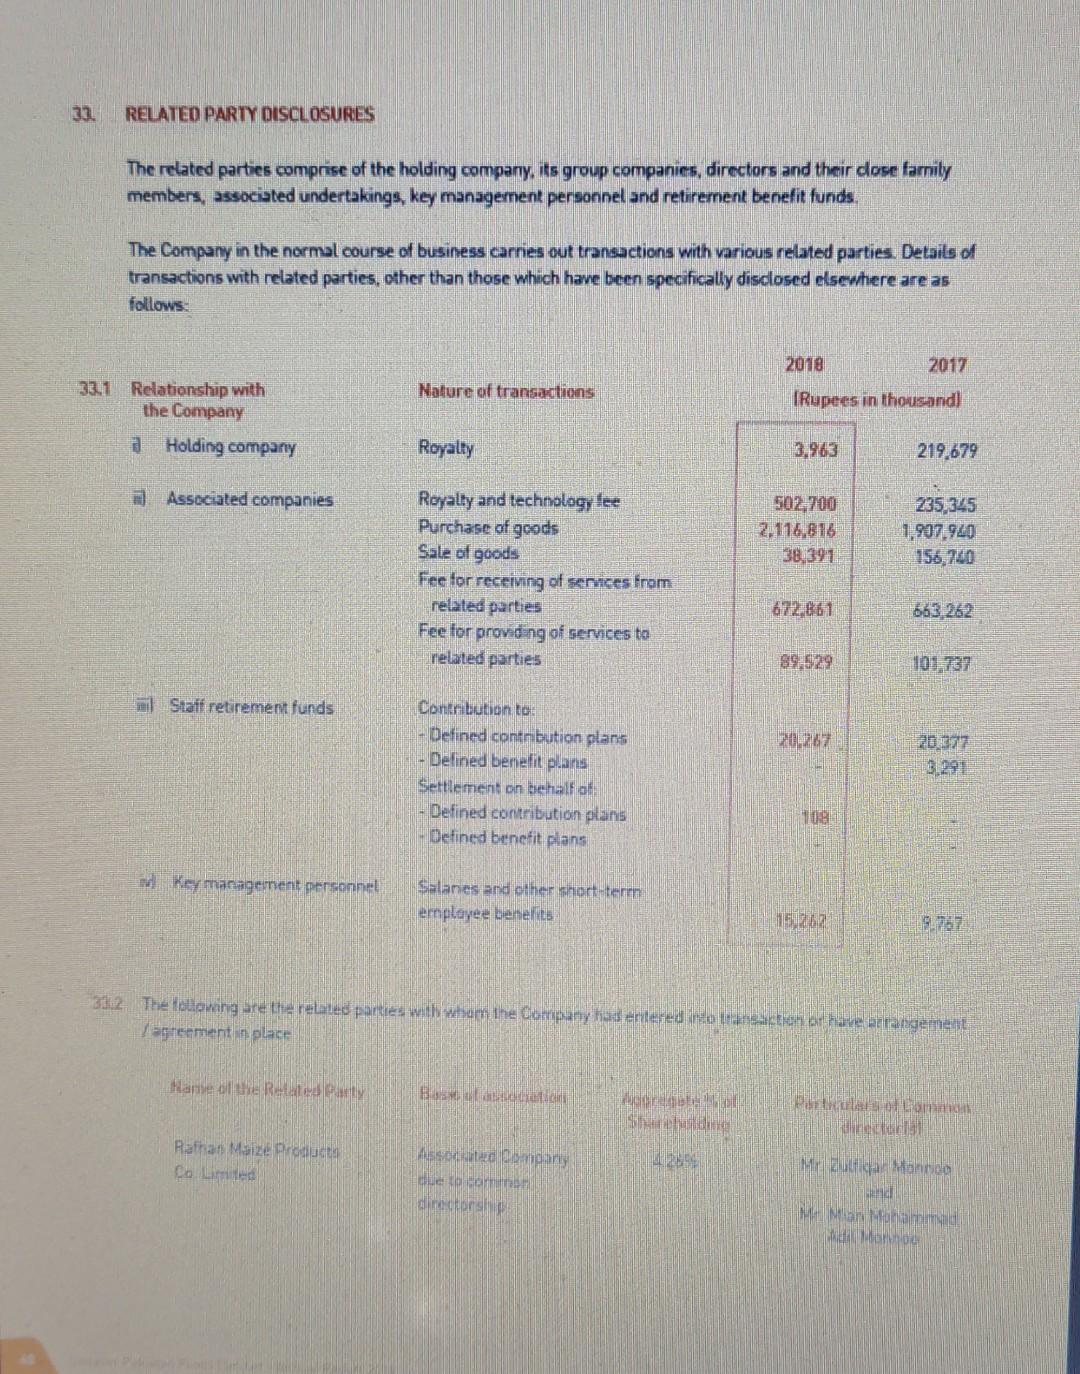
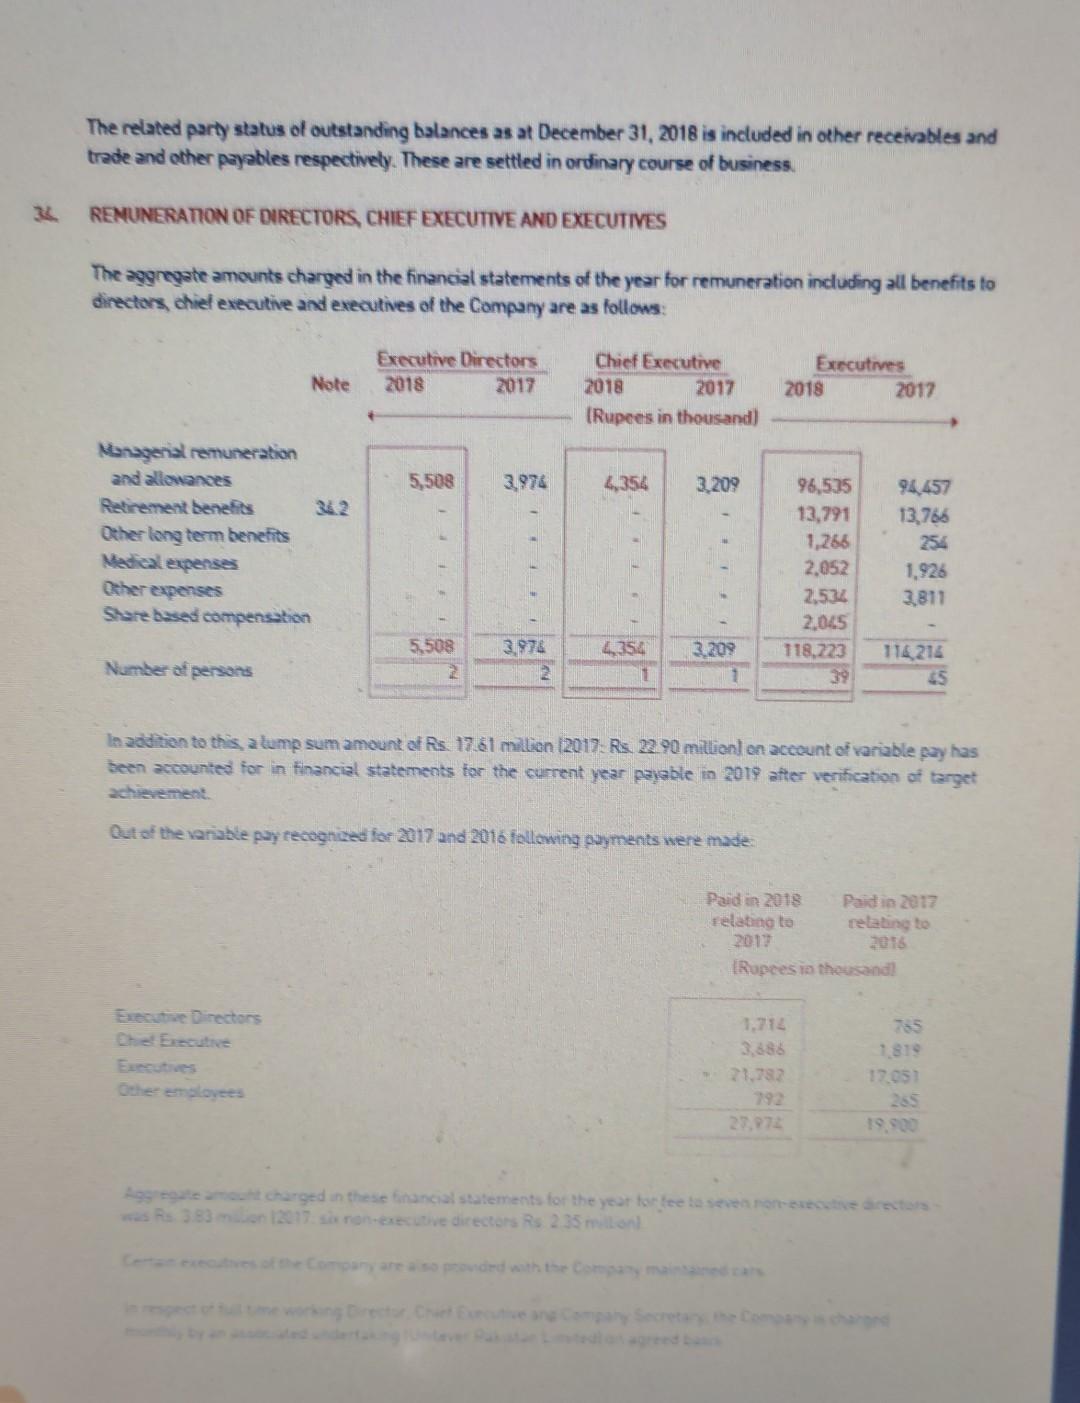
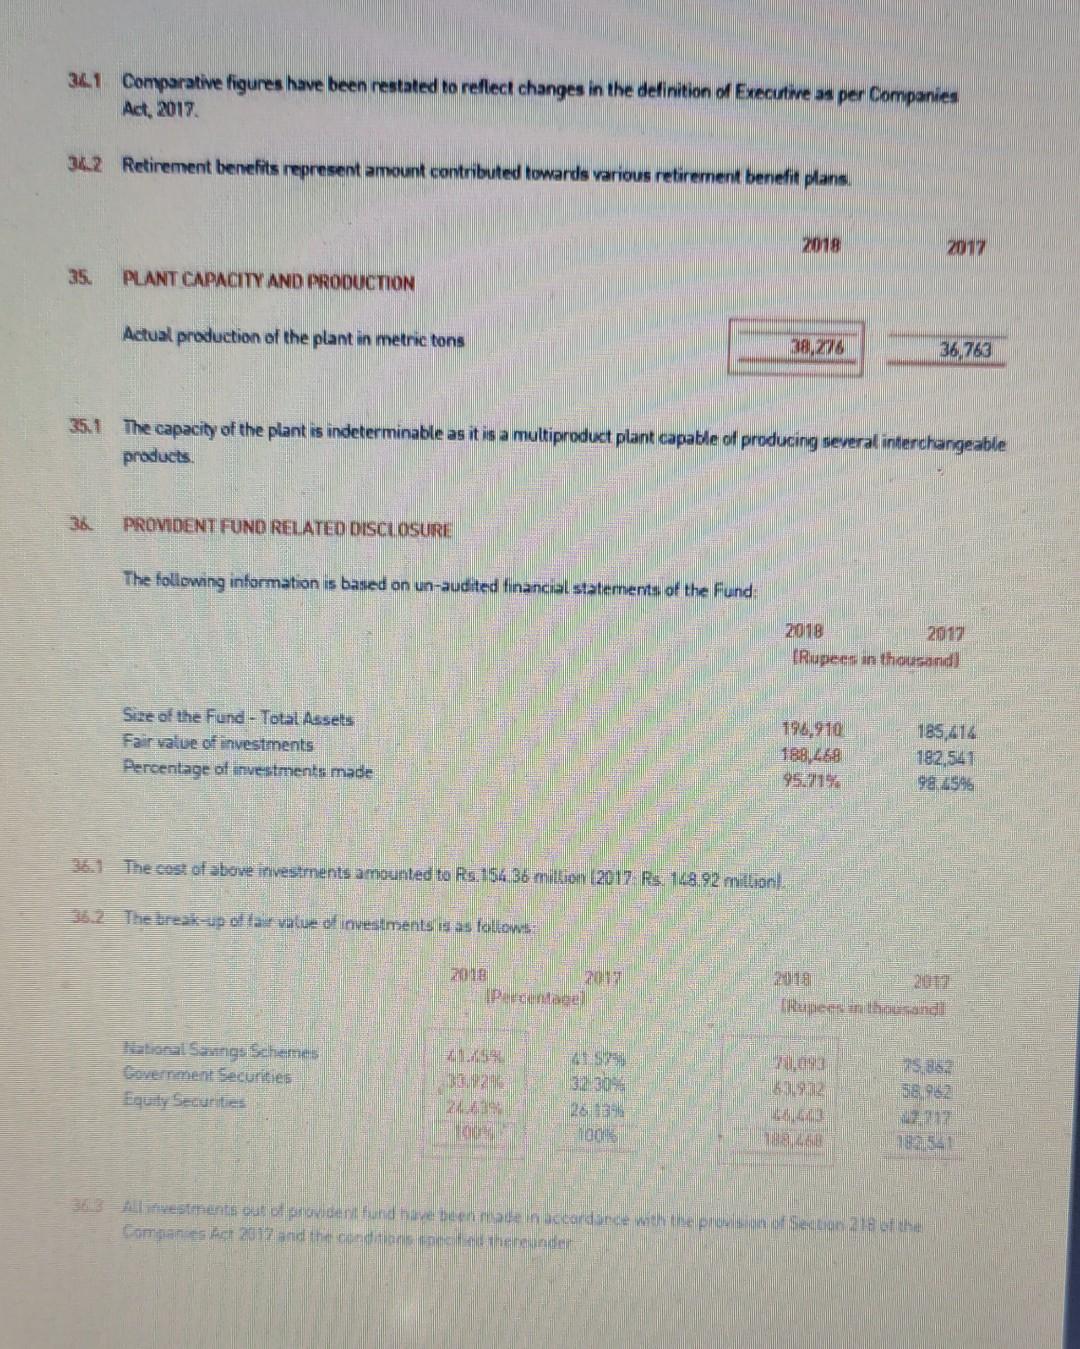
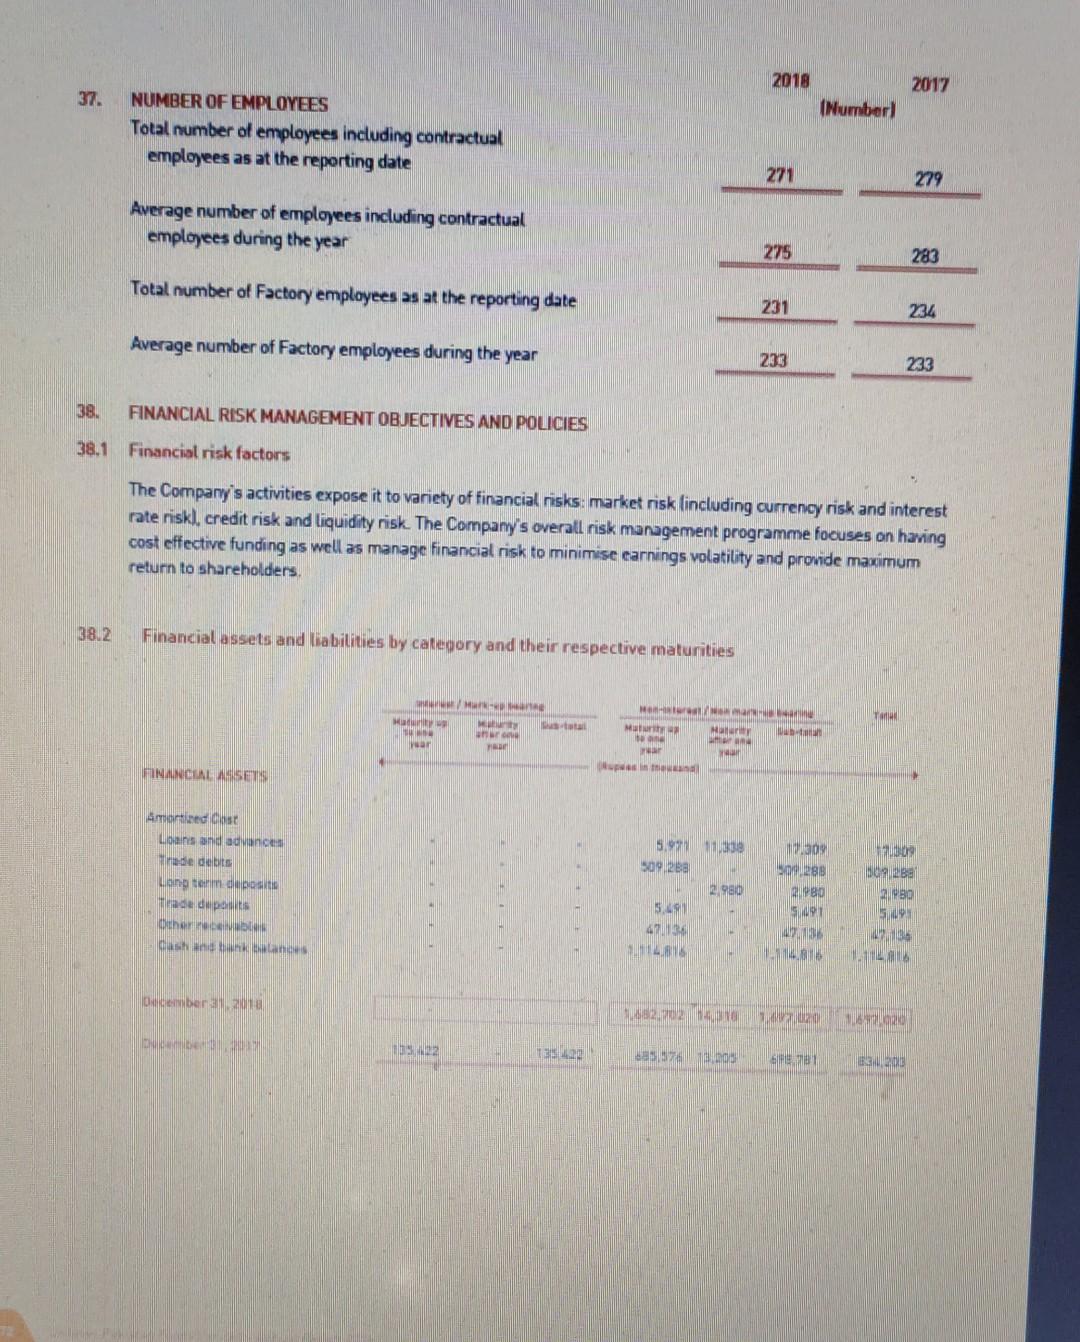
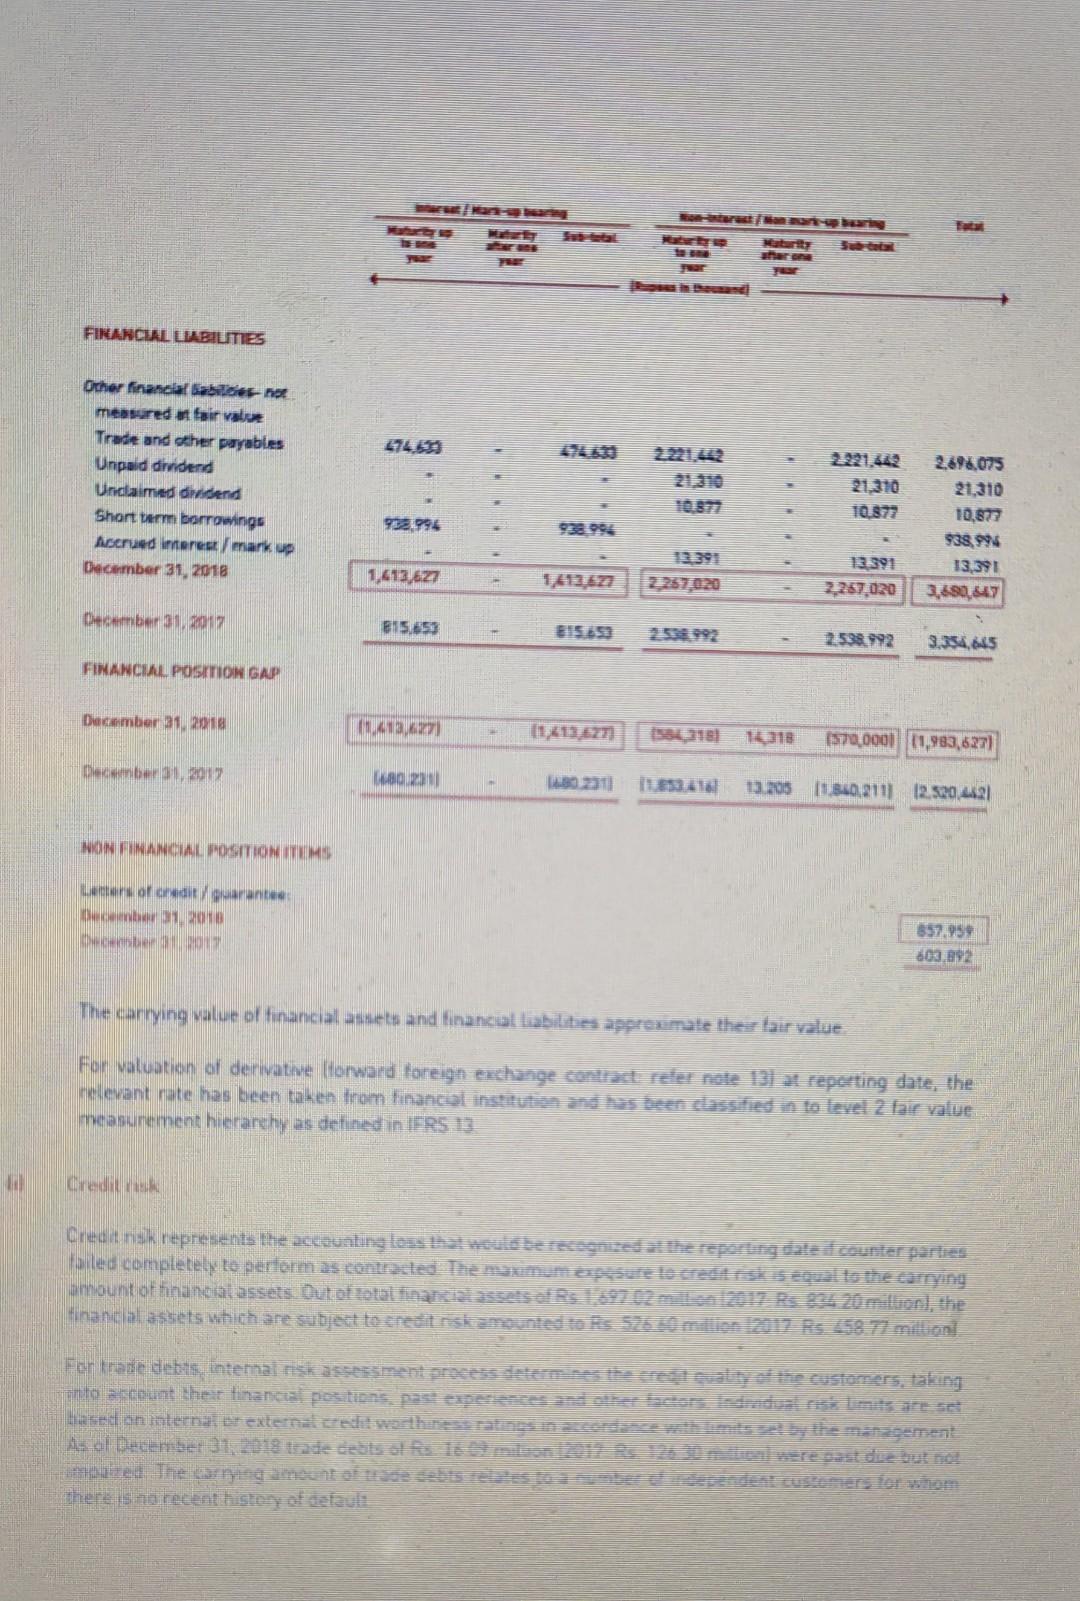
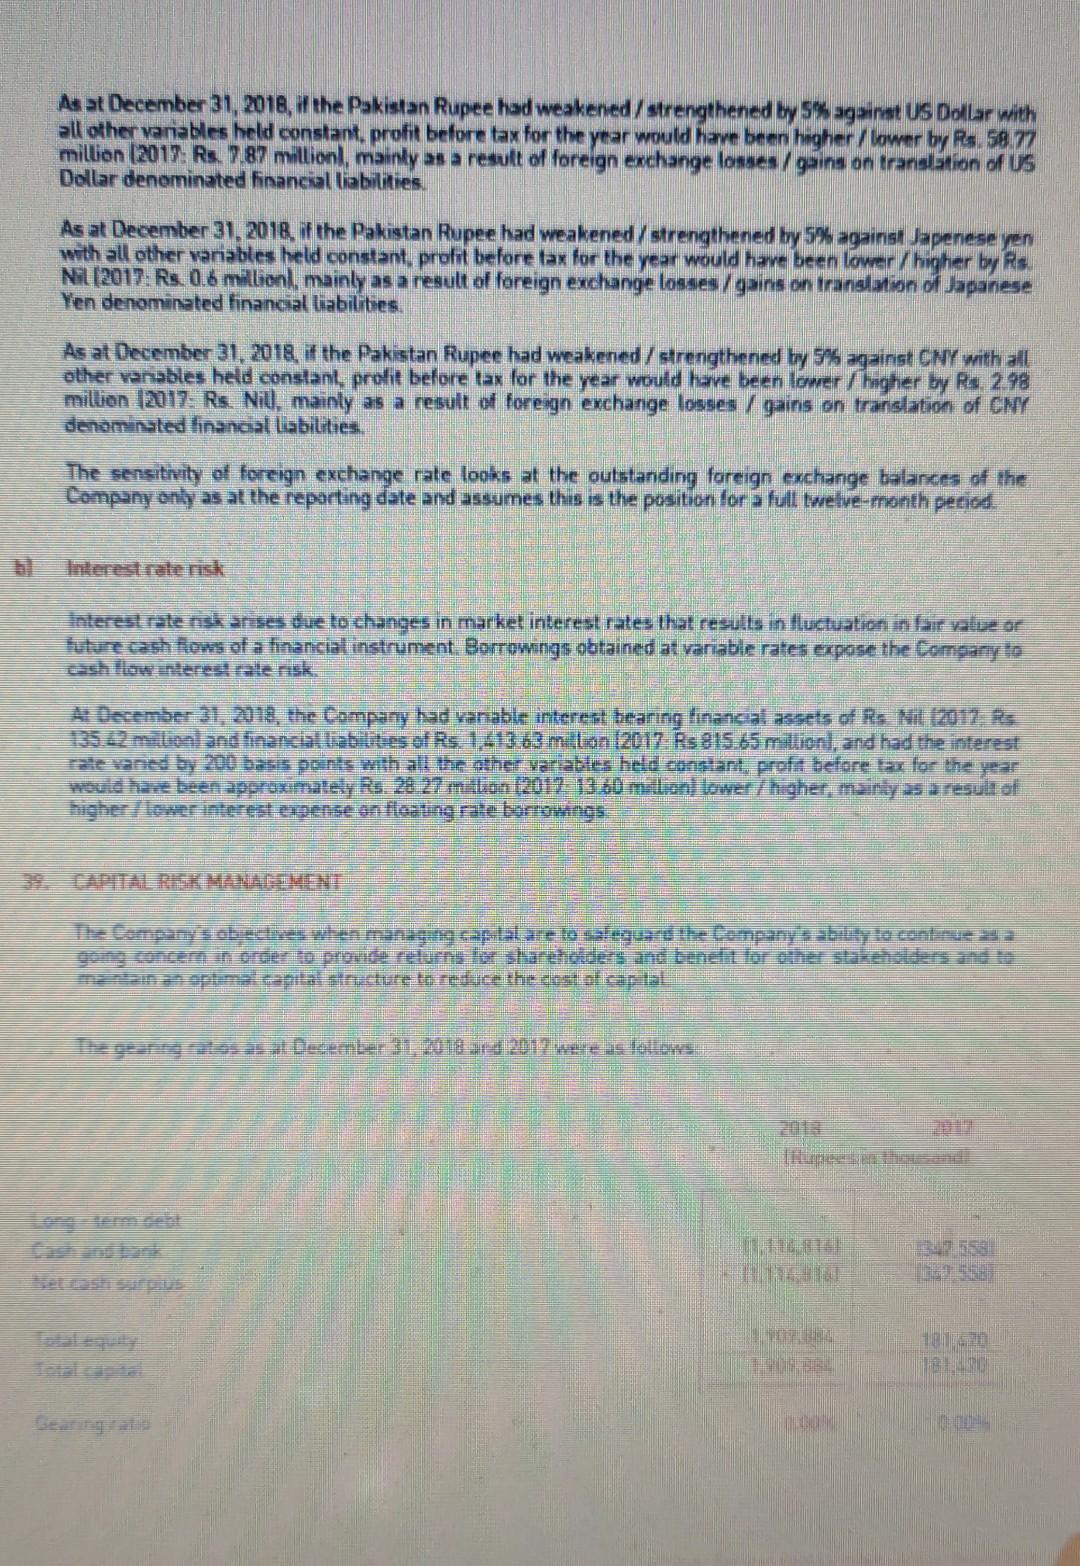
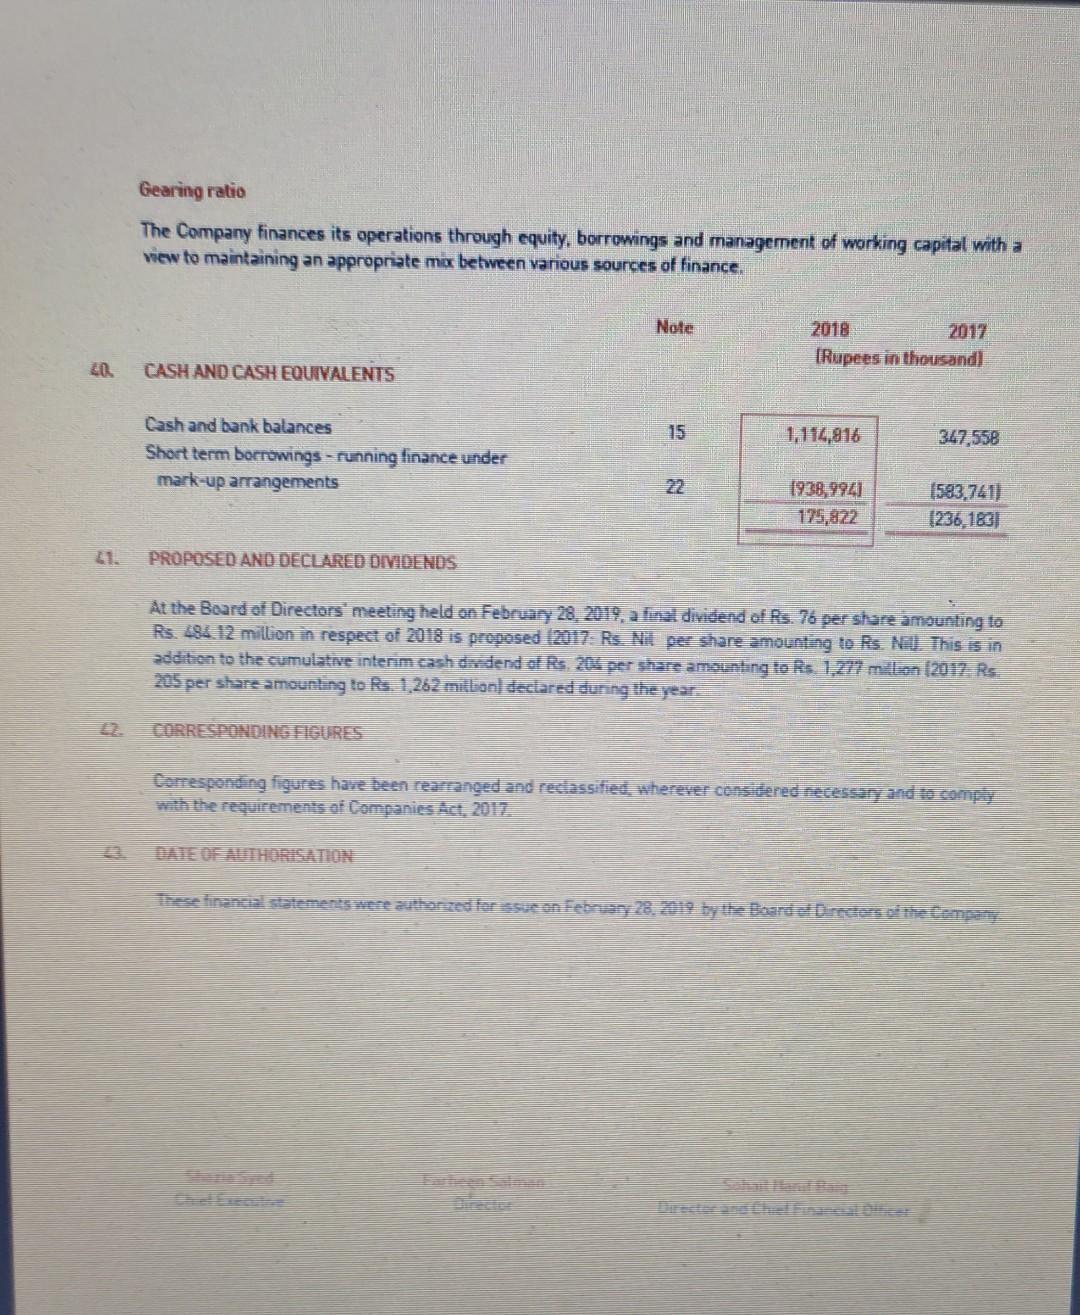
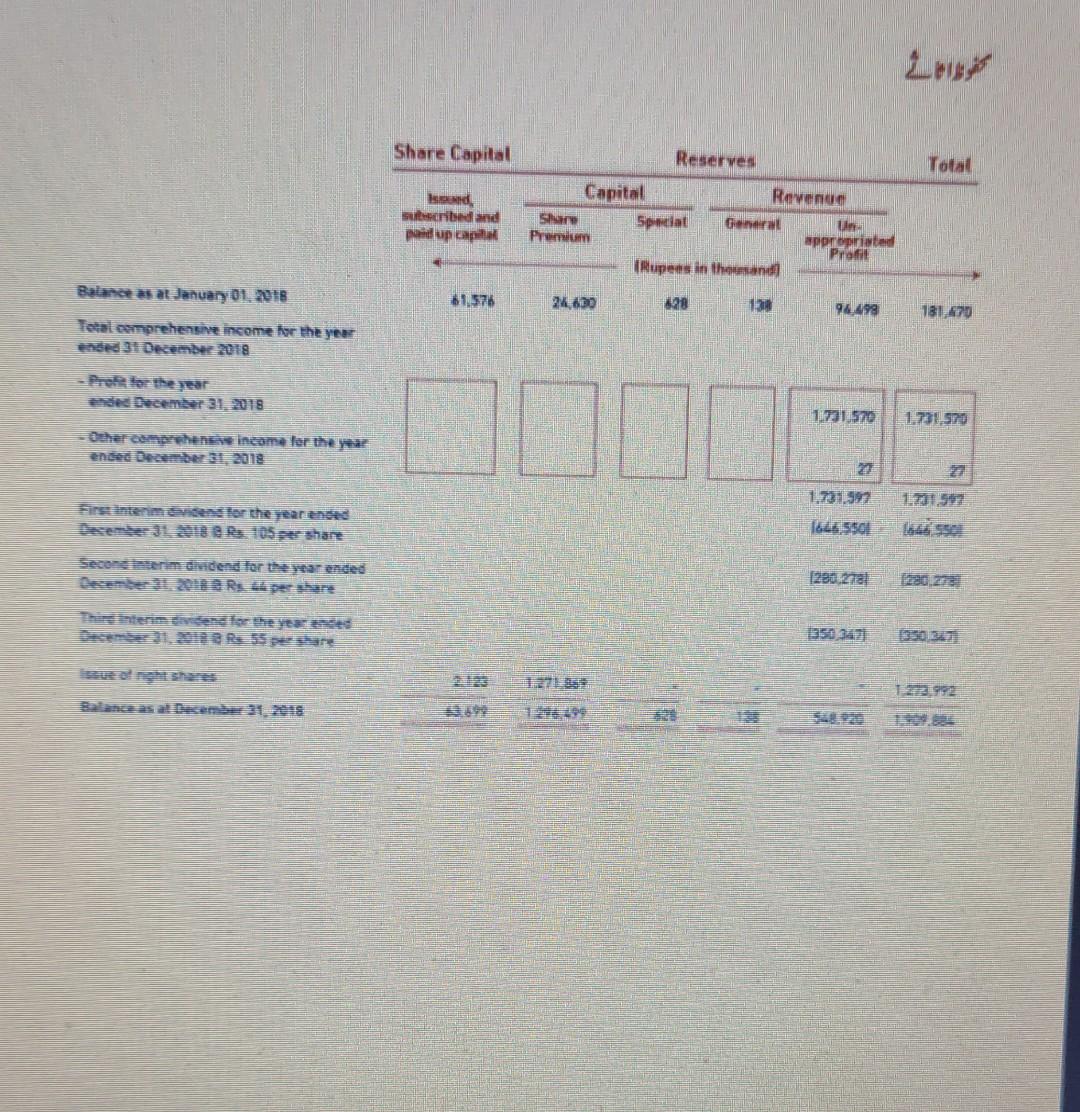
KPMG Taseer Hadi & Co. as the Auditors of the Company for the year 2019, subject to Shareholders' approval at the next AGM to be held on April 09, 2019. Holding Company Through its wholly owned subsidiary Conopco Inc, USA Unilever NV Netherlands, as a holding of 76,5% of the share in UPFL, and the Company's ultimate parent compary Subsequent Events No material changes and commitments affecting the financial position of the Company have oppurred between the end of the financial year and the date of this report. Reserve Appropriations Share Capital Reserves Total muscribe paid up empt Capital Revenue Shaw Special General UR Premium propre Pro Rupees in the sand Balance as at January 01, 2018 61.578 24,630 628 139 94498 181470 Total comprehensive income for the year ended 31 December 2018 -Profit for the year ended December 31, 2018 1.731,970 1,731,320 Other comprehensive income for the year ended December 31, 2018 27 27 1731.397 1731527 Tas, 550 First Interim didend for the year ended December 31, 2018 Rs 105 per share 1280,2780 1280.270 Second Interim dividend for the year ended December 31, 2018 @ Rs 44 perahu 13303171 1350,367 Third Interim dividend for the year ended December 31, 2018 Rs 55 per issue of night shanes 23.492 1271869 613.699 B 1296299 129 5. Balance as at December 31, 2018 1.109.99 Acknowledgement Our people are the key drivers behind the sustained growth of UPFL The directors acknowledge the contribution of each employee of the Company. We would also like to express our thanks to our customers for the trust shown in our products. We are also grateful to our shareholders for their support and confidence in our management. Future Outlook Despite challenging economic and operating environment, the business has continued to deliver positive results. We are committed to deal with the challenges that he ahead with our access to global expertise, superior connes undertanding, portul innovations and world is customer service. We believe that our dedicated and focused effortsatt provide better value to meet consumers meryday needs and deliver sustained profitable growth for the benefit of a Stakeholders Thanking you all On behou of the Board ron Mirra Shana sud Che Statement of Financial Position Horizontal Analysis for 6 years MLM 2018 19 Re. 2012 17. PIOE *** DTS NEW KILDE 20 A. 2012 RE R. EQUITY AND LIABILITIES Capital and reserves MENE BUBTN Share capital eserves NA HL 1,044,10 1,104, TATLON MURT EEN LAW 11.10 on. NEM RELIA MOON IN DR TOIT MEN IGNAC REN FEME TATO W CEE AIN Non-current abilities UND Stiinement benefits Delete con IMME 313.70 163 16.000 TO 1.NO 2012 AM IN BALE CREA war MET W THEM RE MELON al 2110 HA) AM NOW 1122 1.ME Current liabilites Trade and operates DIA LAKET LLERIET 4623 2. EM BILM WOMAN 3.634 INGUR 97,43 D COLE IM WING DEP ALAM NES 12 M - / -- NE 15.00 791 INFO CIMB GO el TODA TO Short borrow 1 100.00 780741 s ta DI 1100 112 BE TI CE 2.1 CE IN 16 42 am 0 2012 110 2.NA 17 EM LI BE Am 24 ASSETS on-cotenta sets Desperti pendeuren BUNUN 24 1.99 1 MON OL LE 13.203 ME 200 ml AR mi Long term toons and advances Songtemps and present rents 1.400 4,05 bar N 9 4 TH IA DOT ULTES MEER HEN H 12 N RA WE GE AN I 4.33 ons and advance ME - LA 44 DEN 34 . 10000 LEH PREM M . Statement Financapon Analysis C Statement of Financial Position Vertical Analysis for 6 years Penthousandl 2013 2013 2 RE EQUITY AND LIABILITIES Capitaland reserves NE 13 HT TEN Searcanica Ha NEE NE ETA EJE 2303 BU Non current abilities 0.13 2.35 60 Current liates UTET ZA UT NE RE To ASSETS SALE an TE LA WE MS Profit or Loss Account and Other Comprehensive Income Horizontal Analysis for 6 years 2010 Ru 18 V. 2017 17. KO 2016 Au. 16 V8. 15 2015 157.14 14 7:12 IR in thousand 2933 12.12 AM SMS 11.30 1073 10,745,250 18.50 1466,836 10.45 4571,091 10.07 7,787,059 11.90 6956,866 18.73 Cost of Ano 10.41 15.211.6N] 122132164,421 1110 IATO3.00 704 14.425,7071 7.27 14.05.2008 11.57 Gross proht 6,35,302 10.88 4,833.560 1502412.215 9.65 3.832.213 140 3360,070 15.58 2,907,564 30.39 Diserbution Cost (2.42 12 12.647.3201 10.12.233.100 125 11.754.0228 33.13 1.455,7700 17.30 11.20 Administrative penses 315,392) 419 1362756 *5.15 1155,137 115428 14.01 1180.740) (156,4728 5.09 one persing expenses 1142.0141 2.76 OL 1125.37 [127.2133 7.80 [115.8571 1945 Other Income 12.115 86.72 202.721 68.49 103,174 113.562 56.56 72.549 (1729 Profitrom operations 2171 3137 12.15 1.939.772 1512 142018 36 38 Finance costs 167.18751 16 26.01.201 24:50) 138,090 122.5.2) 149,2931 450.62 17.043) 12.11 Prat Debretion 2,46 23 1.720,706 3.65 1.772 1.805.68 11.43 1,68022 15.01.09 38.53 Taxanion 1780.1461 1565.03.31 1692 1491.669) 1433.5591 118,321 1518,168 1285 1459.100 33.77 Protteration ITULO 2773 1.355,073 1.776.GA 393 121130 5.15 1.121821 18 1,004999 37.80 Omer comprar name/ 2 100 541 1912 (42734 15:25 [134.49) 142113591 1008 (185.90 L. 1753 230.851 Tomprehensive income 1.73 20.30 1.350.601 573 270.014 1.227.797 88 1.121 30 1,001,500 1752 Vertical Analysis for 6 years thousand 2011 20 2015 R RE Sal DO 200 100.00 700.00 00.00 WEZO 10000 00.00 O. SA 15.0 254 1! 155 40 562 454 3.54 132 sono 10 2. D C 02.02.2010 Del 12 IS 2250 3 2127 Ha 42 1900 12.00 Operating TEAMN 11 IT. com 2. 10 2. rom 25197 2 10 4 an an . LUT - Pattern of Shareholding As at December 31, 2018 Number of Shareholders Shareholdings Stad Total Shared 480 101 10 15 to to to to 16 to to 2 2 2 3 2 1 1 1 1 1 101 501 1,001 5.001 10,001 25,001 35,001 45,001 50,001 60,001 65,001 75,001 80,001 95,001 115,001 125,001 135,001 4,875,000 to to 100 500 1,000 5.000 10,000 15,000 30,000 40,000 50,000 55,000 65,000 70,000 80,000 85,000 100,000 120,000 130,000 140,000 4,880,000 20,487 19.256 11.692 29,14 24.617 25,150 59,750 75,086 145.816 108.096 63,795 69 500 78.524 80.344 298,058 117,786 129,028 139,515 4.876.296 6.369.950 to to to to to 1 to 1 1 to 1 841 to to Categories of Shareholders Number of Shareholders Number of Shares Held Parcentage Associated Companies, undertakings and related parties 4,876 296 76.55 Directors, CEO and their spousels) and minor children 12 196.970 6.23 PubSector Companies and Corporations 2 Banks, development finance institutions, e banking finance companies, insurance companies, takaful, modarabas and pension funds 2 1.107 B06 093.238 2.00 Foreign companies 23 0.00 10 39.95 Statement of Financial Position As at December 31, 2018 Note 2018 2017 Rupees in thousand ASSETS Non-current assets 5 2 Property, plant and equipment angible assets Lone term deposit and pressment Long term loans and dances 81,637 7,783,569 81,637 2.980 11,338 7879,504 exy 13,205 2,087,816 rent assets Stores and spars Stock in de e e-4 Frasie depossa shorterarepments Other secera 1993 Statement of Financial Position As at December 31, 2018 Note 2018 2017 [Rupees in thousand) EQUITY AND LIABILITIES Share capital and reserves Share capital Reserves 16 17 43,699 1,846, 185 1,909,884 61,576 119,894 181,470 LIABILITIES Nonent liabilities Staff retirement bene its Deferred taxation 18 19 14,000 141.590 155,590 9345 203,785 213.130 Current liabelitres Trade adeher Pyables 20 2,835,390 21.310 2,773,124 Undaimes divadend 3 30653 Accessed interest mark up Siestas pate Shorter barns 22 3.89978 The snazed rotes to an integral part of these financial statement Statement Profit or Loss and Other Comprehensive Income For the year ended December 31, 2018 Note 2018 2017 IRupees in thousand) - SIN 24 11,898,200 10,745,260 Cost of sales 25 16,539,088) 15,911,896) Gross profit 5,359,342 4,833,564 Distribution cost 26 12,682,6581 12,649,320) Admistratwe expenses 22 1315,3921 1302.756) the operating expenses 1142,016) 1137.523) Other income 29 1322, 115 202.771 2,561,391 1,946,726 169,475) 126,0201 Profit before taxation 091716 1920.706 1760,146 1555,033) 1,731,50 0355,673 tems that will not be reclassified to profit or loss glamentais benefits testions 17.1021 12.10 1992) 2 Hems that may be subsequently teclassified competence 1390 MS Dees for resisrestate gesit Entre Statement of Cash Flows For the year ended December 31, 2018 2018 2012 Rupees in thousand Cash flows from operating activities Proft before taxation 2.491718 1,920,708 166417 Adjustments for non-cash charges and other items Depreciation Gain on disposal of property, plant and equipment Provision for staff retirement benefits Provision for impairment of fixed assets Mark-up on short term borrowings Retum on savings accounts 3,052 22.187 169,067 1200) 4694 89,000 54,278 16,537) 310.8.42 2,802,55 14,268 (17,611) 186,288 2,106,994 Effect on cash flows due to working capital changes Decrease increasele current assets Stores espres Stock arade Trade dents sans and advances de Deports and short term prepayments tax refundable 140170 149,571 1136 838) (13,6091 108 170,5211 1923) 0628 182,413 122 100.9252 (10517] 18331) (192784 creascrease in currenties rade noches payables 28 122 Stax payable 357240 3.036 199,999 266 207 155 Cenerated from operations de tonal TA 1758 Statement of Cash Flows For the year ended December 31, 2018 Note 2018 2017 (Rupees in thousandl Cash generated from operations brought forward) 2,753, 776 2,175,487 (13,175) 11,038,698) Mark-up paid Income tax paid Staff retirement benefits - contributions paid Long term deposit and prepayment Decrease/Increase) in long term loans Net cash from operating activities 111,975) (278,214) (3,291) 2,805 1903) 1,883,709 12,980) 1,867 1,670,790 Cash flows from investing activities Purchase of property, plant and equipment Proceeds from disposal of property, plant and equipment Return received on savings accounts 194,702) (1,029,442) 260 6,537 17,611 Net cash used in investing activities 11,042,445) 197,091) Cash flows from financing activities Proceeds from issue of right shares Dividends paid 1,273,992 11,190, 732) 1216,340 41205 Net increase / decreasel in cash and cash eguralents 12,737,580 12,737 680 1930,982) Cash and cash equivalents at beginning of the year 369 694,779 Cash and cash equivalents end of the year 126 1837 The annexed notes to formanntegral pathetics Shana Syed Chet Breuta Statement of Changes in Equity For the year ended December 31, 2018 SHARE CAME CAPITAL RESERVES RAVENUE TOTAL den MOTAAL There what we Hal theve Bences 1.2017 1.5 A 30 528 19 1717.146 Transactions with one or se empang 1,732 Fina disene for the year ended December 31, 21228 perware 211.814) 1211,819 121136) Tin Intem dividend for the year ended December 3132019 122 per share 1751.2211 17585229 Secres Intervieng for the year ended December 2013 50 pesh 1307.831) para Teans overensee December 31, 2018 Orare 12.03.2011 1209.2011 Total comprehensie income to the Per yere DE3117 year eno December 2011 630 2 BBC anted notes to the Chuo lalo na Orecto CHO Director Chile Gorice Operating assets Total brechen Felicias Piants Electrical Fume _thinery Chasiat ments and office equipment lupees in thousandl Neaming Water Tearded December 31, 2018 31231 Opening Ni Dio e NY Adations 06.185 20 Disposals Dest . 1570 . 14,795 Acomiated Depreciation WIRL provision for mpwd asses Disposals NBV Depreciation charge Ner charge of provision for mpamento ed asse Oleng NSV 12230 1187,071 187.0008 58 1583 1 172018 Oras Garning value bisas Al December 31, 2018 Dost 3.17 573 12.567 16.03 1.05 -2.7554 Provision for impactanter 11511 312 178,916 61,575 7,658 1956 121.709 114B 11:22391 1122151 1405 Accumulaned depreciation Going Nov 6,179 1,181,139 23 172 Net canning value basis de mer 31, 2017 Ona Not300 NEM Anational 179 49140 55.55 1 3.410 10 con Disposal NA nepog GO MS 114 Orang I At December 2017 - nova F 6.2 Capital Work in Progress - al cost 2018 2017 (Rupees in thousand) 86,465 Plant and machinery Cmil works Advances to suppliers 952 387 172,179 30,818 1,055,284 1,545 88,010 6.3 Particulars of immuable asset of the Company are as follows Address Usage of immovable property Manufacturing Plant Covered area sq ft 717300 sq feet Foods Factory S2KM, Multan Road, Phool Nagar. Tehsal Pattoki, District Kasur. Lahore NTANGIBLE ASSETS Gross carrying value bass 2017 (Rupees in thousand Cost Persementes restraint of trade 137,661 Reculated artization and mpairment Net blue The above represents amount paid for the acquisition of Glaxose DE 1999 Caxo Welcome Balestan Lente TR-Ghxckinepakistan Limitedl. De gement has assessed the seful life of the larg ble as ndetite se its expected to the undering and, lakbe, ali operate in the market for an indefinite penod of time For inspirant testing, the estimated severable amount has been determined using the discounted sth Basser period of years Kastamation usein estimation of recivezakte amount of Forests based on both internal and externet tarmont permanen dient bie The oceant rate used 1 034 217756 pre tax measure based on government bonds at The valisation exceeds the carrying and settiden sich that can hly poble ingen met ons LONG TERM DANSARSAVANCE Recorate with one year chico 8.1 2018 2017 Rupees in thousand Reconciliation of carrying amount of loans lo executives: - Opening balances - Disbursements - Repayments 20,003 9,892 (12,384 17,309 17,569 12.755 (10,301 20,003 Loans te employees have been provided to facilitate purchase of houses and vehicles in accordance with the Company's policy which are repayable over a period of five years and are interest free. The maximum aggregate amount of loans due from executives at the end of any month during the year was Re 100 million 2017 Rs. 22.91 milion STORES AND SPARES 2018 2017 (Rupees in thousand! 13,092 26,34 Soares includingin ang Rs. 1.01 milie, 2017: Rs 0.76 milli 38.923 57,033 12.990) Provision for obsolescence 37.688 12,220 35.446 Stores sparese. Nit (2017. Rs. Nu were written off during the year. XIN TRADE IRupee thousand and packing materials including in trang 72 73; 20Rs, 102.2 million 138627 5219 556 2022 1592993 589 14344 0245 cludeRS 77. 60 milionea with parties 102 The Company made provision of Rs. 10146 milion 2017 R$ 145 motor obscence and offertory Rs 50 milion 2011 Rs 55 milkie by utilizing the proudongth Note 2017 2018 (Rupees in thousand) 11. TRADE DEBTS Trade debts Less: Allowance for impairment of trade debts 11.1 536,952 127,664) 509,288 163,471 (24,704) 438,767 11.1 The Company has charged a provision of Rs. 2.96 million (2017: Rs. 0.90 million and has not written off any debtors during the year (2017: Na). 11.2 As of December 31, 2018, trade debts of Rs. 16.09 million (2017: Rs. 126.30 million) were past due but not impaired. These relate to a number of independent customers for whom there is no recent history of default. The age analysis of these trade debts is as follows: Note 2018 2017 (Rupees in thousand Up to 3 months More than 3 months to not later than 6 months More than 6 months 9.272 4623 16,095 112,516 8.206 3,579 126,301 12. LOANS AND ADVANCES - considered good 5,971 6,798 Current portion of loans to executives Advances to: executives other employees - Suppliers and others 121 864 331 59 13 13,0 164 155 45 509 12 en 12.1 The advance to executives are given to meet business expenses and are setsed as and when the expenses are incurred. Further the Company provides advance house rent to its employees Note 2018 Rupest 13 TRADE DEPOSITS AND SHORT TERM PREPAYMENTS Trade deposits Prepayments Prepad rerit 18.2 Plan assets held in trust are governed by local regulations which mainly includes Trust Act, 1882, Companies Act, 2017. Income Tax Rules, 2002. Employees Contributory Funds Investment in Listed Securities) Regulations, 2018 and Rules under the Trust deed of the Plan Responsibility for governance of the Plan, including investment decisions and contribution schedules, lies with the Board of Trustees. The Company appoints the trustees and all trustees are employees of the Company. 18.3 The latest actuarial valuation of the Fund as at December 31, 2018 was carried out using the Projected Unit Credit Method". Details of the Fund as per the actuarial valuation are as follows: Note 2018 2017 Funded Gratuity (Rupees in thousand] 18.4 Financial Position recondliation 18.5 Present value of defined benefit obligation at December 31 Fair valued plan assets at December 31 120,098) [35,158) 18.6 26,099 25,813 19,375 Movement in the present value of defined benefit obligation Balances as at January 1 Benefits paid by the plan Current service costs 11264 Remeasurement on obligation Balance as at December 31 3.925 2.900 11,8891 29,098 35.158 Movement in value of Iplafaase Fervalue of clansets at January Contributions paid into the plan Benefits and by the plan Interest income Berealiament ondan Fan value of planets at December 31 7.297 00 2018 2017 Funded Gratuit (Rupees in thousand 187 Expense recognised in statement of proht or loss Gument service costs Nel interest cost Expense recognised in statement of 0,925 2,985 269 67 profit or loss 4,892 13,052 18.8 Renzeurements recognisedin Other Comprehensive Income Eigenene loss ilgain) Remeasurement of fair value of plan assets Reneescrements 11.885) 1.846 (39) 5,032 2.100 7,132 Ne egne ability NetSabit aldavay1 Charge for the year Contebution made during the year 2,375 2694 2452 3,052 13,291 Remesurements regidin Other Comprehenstre income Recognised ability asset 139) 7.132 14,000 23.5 Please conseille wag: Genes SE Sang 2012 1295 MO 90 12 OSO 6, 201 6,54 Dior Copy 262 TE 25.913 09 Dentes de emergi 25 2 1.00% 18.16 The expected return on plan assets is based on the market expectations and depends upon the asset portfolio of the Fund, at the beginning of the period, for returns over the entire life of related obligation 18.17 The Company's contributions towards the Rafhan Best Foods Superannuation Fund and Rafhan Best Foods Limited Employees Gratuity Fund for the year ended December 31, 2018 amounted to Rs. Na (2017: Ps 329 million 18.18 The weighted average duration of the defined benefit obligation is 142 years, Expected maturity analysis of undiscounted retirement benefit plans: Less than @wear Over Total 5 years At December 31, 2018 Between Between 1-2 years 2-5 years Rupees in thousand 1,861 7.162 Retirement benefit plans 202 24,311 30,536 18.19 The Company also operates a couple of defined contribution plans which receive fixed contributions. The expense recognised in the current year in relation to these contributions was Rs, 19.743 million (2017: Rs. 20.579 million DEFERRED TAXATION Note 2018 2017 Rupees in thousand Credit balance ansing in respect of: - accelerated tax depreciation allowance - amortisation of intangible assets 182850 199268 202, 118 237 656 22.965 260.821 127,1991 Des balance arising in respect of - prosion for stock in trade allowance for impairment of trade debts proizion for restructuring Dronen for staff retirement benefits her parisons 10,528 TRESSEANDO PER PAYALEES 559 170 331 12 as Secredilities Rosangecheelogyfee ancestros costas 2539 5553 Foticers Welfare Fund Payable to Employee Relinement Benetellung Lality to stare basc compensation Paya Be to provident and contributor pension fund 20.1 Bills payable represents inland Letters of credit under vendor financing arrangements which includes interest cost as per Company's negotiated rates. 2018 2017 Rupeen in thousund 20.2 Workers Welfare Fund Balance as at January 1 Charge for the year 55,958 50,881 106,809 133,945) 72,89% 53 347 34241 87 see 131,630) 55,958 Payment during the year Balance as at December 31 20.3 The Company has a buy 3 get 1 free share plan, which gives eligible employees an opportunity to invest in Unilever PLC shares. After a holding period of 3 years, the Company will award 1 free share for every 3 shares bought. During the current year, 425 shares were awarded which are outstanding as at December 31, 2018 Shane price Unilever PLC 2018 41.09 20.2 Amounts due to related parties included in trade and other payables are as follows: Note 2018 2017 (Rupees in thousand Holding company Other related parties 237,088 203,373 20.084 382,186 PROVISIONS Sindh Intrastructure Cess 22 40,487 12,952 Se 32 293 29, 306 60,659 29 Sindh Infrastructure Balance as ar Janary Carse fer the year Balance at December 094 & 32,293 2.2 Restructucing Balance as aanuary Pravning thay Payments during the year Balance December 31 92206 22. SHORT TERM BORROWINGS Running finance under mark-up arrangements - secured The facilities for running finance available from various banks amount to Rs. 2.68 billion (2017: Rs. 1.33 billion. The rates of mark-up range between 1-month KIBOR to 3-month KIBOR +0.15% per annum (2017: 1-morith KIBOR to 3-month KIBOR +0.15% per annum). The arrangements are secured by way of hypothecation over the Company's current assets amounting to Rs. 1.00 billion (2017. Rs. 100 billion), The facilities for opening letters of credit and guarantees as at December 31, 2018 amounted to Rs. 5.12 billion [2017: Rs. 3.28 billion) of which the amount that remained unutilized at year end was Rs. 4.26 billion (2017: Rs. 267 billion). 23. CONTINGENCY AND COMMITMENTS 3.1 Contingency There were no contingencies as at 31 December 2018 23.2 Commitments Aggregate commitments outstanding for capital expenditure as at December 31, 2018 amounted to Rs. 653.1 million (2017: Rs. 35.6 million). 2018 2017 IRupees in thousand) 22 SAITES oss sales 15,790,887 12,059,010) 13,731,877 11,833,147 11,898,430 14,305,269 11,832,344) 12,472,925 11.727.665) 10,745,260 Returns, rebates and allowances Li The Company analyses its net revenue by the following product groups, Products used by end consumers Products used to entities 9.702.293 7:196,137 11.898.130 8,726 020 2,019.240 10.749 250 242 52 esto domestic customers in Pakistan are 95.9 12017 947%) and to customers outside Pakistan are 15 2017 5 391 of me revenue during the year Remiene costomer approximates.2012 16 the televue of the Company Note 2018 2017 (Rupees in thousand) 25. COST OF SALES Raw and packing materials consumed Manufacturing charges paid to third party Stores and spares consumed Staff costs Utilities Depreciation Provision for impairment of hxed assets Repairs and maintenance Rentrates and taxes Travelling and entertainment 5,111,060 61,131 35,109 131,519 132,712 164,672 90,160 29,776 17.772 4,384 12,028 2,147 6,743 116,586 6,215,299 4,842,898 65,176 17,292 402,847 120,792 160,142 22,167 51,952 16,728 5,369 4922 Sationery and office expenses Othere penses Charges by related party 3,007 108.061 25.1 25,997 Opening work in process Closing work in process Cost of goods mutactured Opening stock of finished goods Purchase of finished goods 26,499 125,997) 5,828,486 431,777 6,216,275 260,245 234,315 371.4 5,539.088 460.225 5.911,896 associates undert werden mited 27.103 25.7 1.119 pas 205, 206 2.649,320 26.1 This includes amount payable to Conopco Inc. Holding Company and Unilever Plc Associated Company 26.2 This represents amount charged to the Company for certain management and other services received from its associated undertaking - Unilever Pakistan Limited, Note 2018 2017 (Rupees in thousand 29. ADMINISTRATIVE EXPENSES 8,308 822 614 Stall costs Depreciation Travelling and entertainment Auditors remuneration Allowance for impairment of trade debts Legal and professional charges 27.1 7,814 845 7,146 2561 2,960 12,161 2132 Other expenses 2722 273 903 9567 1,670 273.987 302.756 Charges by related party 315,32 Auditors muneration 1.000 Annual audit lee Half yearly review Certifications to regulatory purposes Out of pocket expense This includes combo of Rs N:13007 Rs 0.37 milion This represents a most charged to the Company for certain management and other sences received from its associated undertaking - Unilever Balustan Limited HER OPERATING EXPERT ockers Vietare Fund 089 Note 2018 2017 (Rupees in thousand OTHER INCOME Income from financial assets Retum on savings accounts 6,507 17,611 32,734 Income from non-financial assets Serap sales Gain on disposal of property, plant and equipment Reversal of provision for impairment of fixed assets 37.169 400 380 37,989 32,734 Others 29.1 Service fee Exchange gain Others 89,529 195,549 12,511 322,115 101,737 1,072 49,617 202,771 29.1 This includes our charged by the Company for certain management and other services rendered to its associated undertaking - Unilever Pakistan Limited, in accordance with the Service Agreement between the two companies. 2017 Rupees on thousand) FINE COSTS Non short term or towings Ba charge 11.797 26.020 25 513.374 350 1625 506057 of yeas 59.97 5550 31.1 Reconciliation between tax expense and accounting profit: 2018 2017 (Rupees in thousand) Accounting profit before tx 2.491,716 1,920,706 576,212 17,920) 160,833) Tax at the applicable tax rate of 29% (2017: 30% Tax effect of credits Tax effect of final tax Tax effect of change in tax rate Tax effect of super tax Tax effect of prior years Others Tax expense for the year 722,598 16,551) (42,796) (27,6081 51,176 60,764 2,563 760,146 58.976 (1,402) 565,033 31.2 The current year tax provision on taxable income is at 29% (2017: 30%). Finance Act 2018 enacted gradual reduction in the corporate tax rates for companies from 29% (current tax rate) to 25% over a period of five years. The Company computes current tax expense based on the generally accepted interpretation of the tax laws to ensure that the sufficient provision for the purpose of taxation is available. According to management, the tax provision made in the financial staternents is sufficient. A comparison of last three years of income tax provision with income tax as per assesment is presented below: 2017 2016 2015 (Rupees in thousand Income tax provision for the year 550,437 529,624 350793 Income tax as per assessment 546,888 528,287 351,793 The above previons are inclusive of prior year tax charge booked in subsequent years, if any. Moreover, the armounts are also inclusive of super tax paid under protest for respective years. 2018 2017 TRupees in the end DAST ANODILUTED EARNINGS PER SHARE Profit after taxation attributable to ordinary shareholders 1,721,5VO 355,673 Weighted average number of shares in issue during the year (Number in thousand 8,309 0,200 2 earnings per share trectated) Rupees 2949 2185 There is no dilutive effect on the basic earnings per share of the Company, 331 RELATED PARTY DISCLOSURES The related parties comprise of the holding company, its group companies, directors and their dose family members, associated undertakings, key management personnel and retirement benefit funds. The Company in the normal course of business carries out transactions with various related parties. Details of transactions with related parties, other than those which have been specifically disclosed elsewhere are as follows: 33.1 Relationship with the Company Nature of transactions 2018 2017 [Rupees in thousand) a Holding company Royalty 3,983 219,679 a) Associated companies 502,700 2. 116.816 38.391 235,345 1,907,920 156, 7:40 Royalty and technology lee Purchase of goods Sale of goods Fee for receiving of services from related parties Fee for providing of services to related parties 672.861 663 262 101.737 mi Siatt retirement funds 20,267 Contribution to - Defined contnbution plans - Delined benefit plans Settlement on behalf of Defined contribution plans Defined benefit plans 20377 0,291 108 Key management personnel Salanes and other short-term employee benefits 52 3112 The following are the related parties with whom the Company had entered action or have a rangement agreement in place Name of the Retales y H , I fit, ULHI[ Jir | GO S of common Rafhan Moze producto Co Limited Mr Mando Associate nang we can directors man Mohammad The related party status of outstanding balances as at December 31, 2018 is included in other receivables and trade and other payables respectively. These are settled in ordinary course of business, REMUNERATION OF DIRECTORS CHIEF EXECUTIVE AND EXECUTIVES The aggregate amounts charged in the financial statements of the year for remuneration including all benefits to directors, chief executive and executives of the Company are as follows: Executive Directors 2018 2017 Note Chief Executive 2018 2017 (Rupees in thousand) Executives 2018 2017 5,508 3,974 4,354 3.209 Managerial remuneration and allowances Retirement benefits Other long term benefits Medical expenses Qher expenses Share based compensation 96,535 13,791 1,266 2,052 2.534 2.045 118,723 39 94.457 13.766 254 1.926 3.811 5,508 3.209 Number of persons 3,974 2 4354 1 114214 5 1 In addition to this, a lump sum amount of Rs. 17.81 million (2017: Rs. 2290 million on account of variable pay has been accounted for in financial statements for the current year payable in 2019 after verification of target achievement Out of the variable pay recognized for 2017 and 2016 following payments were made Paid in 2018 Padin 2017 relating to relating to 2017 2015 Rupeesia thousandl Execute Directors Chef Executive 1,712 3.888 21.787 735 1819 17051 285 19.900 Gesloves 27.972 A to charged in these financial statements for the year for teetaseverovata 3.3.2017 non-executive director Rs 2.35 man 341 Comparative figures have been restated to reflect changes in the definition of Executive as per Companies Act, 2017 34.2 Retirement benefits represent amount contributed towards various retirement benefit plans, 2018 2017 35. PLANT CAPACITY AND PRODUCTION Actual production of the plant in metric tons 38,27% 36,763 35.1 The capacity of the plant is indeterminable as it is a multiproduct plant capable of producing several interchangeable products PROVIDENT FUND RELATED DISCLOSURE The following information is based on un-audited hinancial statements of the Fund 2018 2012 IRupees in thousand) Size of the Fund - Total Assets Fair value of investments Percentage of investments made 185,414 194,910 188258 957194 98 2996 3.1. The cost of above investments amounted to Rs. 154.36 million 2017 Rs. 148.92 million). 3. The resultat value of investments is as follows: 2014 2012 IP a The hindi National Songs Schemes Government Securities mu 1323094 28 1962 22 075 303 Arvestments out of providerit fund haben ein accordance with the promo 18 h Companes act 2017 and the conditions the under 2017 37. 2018 (Number) NUMBER OF EMPLOYEES Total number of employees including contractual employees as at the reporting date 271 279 Average number of employees including contractual employees during the year 275 283 Total number of Factory employees as at the reporting date 231 234 Average number of Factory employees during the year 233 223 38. FINANCIAL RISK MANAGEMENT OBJECTIVES AND POLICIES 38.1 Financial risk factors The Company's activities expose it to variety of financial risks: market risk lincluding currency risk and interest rate risk), credit risk and liquidity risk. The Company's overall risk management programme focuses on having cost effective funding as well as manage financial risk to minimise earnings volatility and provide maximum return to shareholders 38.2 Financial assets and liabilities by category and their respective maturities HAN To M total Mart M - ar ar FINANCIAL ASSES 5,97 5092 2.30 309 29 Amortized Cost Loans and advance rede deuts Long term cupou. Tad dupos Other Pub Cash bunk balances 30 500288 PBD ST 2980 S. 47,34 20 SU Cember 20 2002-20|| be 2 1135,420 16 200 FINANCIAL LIABILITIES Other financial abides no measured ut fair value Trade and other payables Unpaid dividend Undaimed diridend Short term borrowings Accrued interest mark up December 31, 2018 221.422 21,310 10.872 0877 932.996 2.696,075 21,310 10.87 938,994 13,391 2,850,47 13391 1,413,627 2267020 2,267,020 December 31, 2017 E15.653 2538.992 2.538.992 3,734,645 FINANCIAL POSITION GAP December 21, 2018 262 191 (570_0000 11,993,627) December, 2017 WO 13.705 11.840,211] 12.520 421 NON FINANCIAL POSITION ITEMS Letter of credit / quarantee Do 120 857,959 803892 The carrying value of financial aness and financial liabilities approximate the fair value For valuation of derwatie Horward foreign exchange contract refer note 13) at reporting date, the relevant rate has been taken from financial instituti h beer classified in to level 2 fair value measurement hierarchy as defined in IFRS 13. Credit Credit nak represents the accounting lossisterecognized the reporting date counterparties bled completely to perform as contracted The maximum outros seal to the carrying amount of financial assets. Outot total finantsess of Rs 1972. 2017 R 320 milson), the financial assets which are subject to credit riskamounted to Rs. 300 tion 2017 RS. 258.7 million Fortrade debts, internal disk assessment process determines the results of the customers, taking anto account their financial positions past experiences and other ter data limitarse based on internet externacreditworthiness latinos conceithis the manzoement As di bedensber 31 2018 tande tests of 2017 Roure est de but not gired The carrying amount to be adent customers for whom there is no recent history of default As at December 31, 2018, H the Pakistan Rupee had weakened/strengthened by 5% agairt US Dollar with all other variables held constant, profit before tax for the year would have been higher/ lower by Rs. 58.77 million (2019: Rs. 7.87 million, mainly as a result of foreign exchange longes/ gains on translation of US Dollar denominated financial liabilities. As at December 31, 2018, if the Pakistan Rupee had weakened/strengthened by 5% against Japenese yen with all other variables held constant, profit before tax for the year would have been lower/higher by Rs. Nil(2017: Rs. 0.6 million, mainly as a result of foreign exchange losses/gpins on translation of Japanese Yen denominated financial Liabilities, As at December 31, 2018, if the Pakistan Rupee had weakened / strengthened by 5% against CNY with all other vanables held constant, prohit before tax for the year would have been lower / higher by Rs. 2.98 million (2017: Rs. Nil, mainly as a result of foreign exchange losses / gains on translation of CNY denominated hinanaal liabilities The sensitivity of foreign exchange rate looks at the outstanding foreign exchange balances of the Company only as at the reporting date and assumes this is the position for a full twelve-month peciod. Interest rate risk interest rate risk anses due to changes in market interest rates that results in fluctuation in fair value or future cash flows of a financial instrument. Borrowings obtained at variable rates expose the Company to December 31, 2018, the Company had vanable interest hearing financai asets of Rs. Mt 2017 Rs 135.22 milion and financial liabilities of Rs. 1.413.63 m lon [2017 Rs 815 65 million), and had the interest rate vaned by 200 basis pants with all the other variables held constant, profit before tar for the par mould have been approximatsy Rs. 28 27 mnaloa (2017 13 60 milion lower i hgher, mainly as a result of Righer lever interestepense en floating rate borrowings CAPITAL RISK MANALMENT The Company s obres when managing capital are lo lequard the Company's ability to continues going concern in order to provide returns to shareholders and benefit for other states and to optum capital structure to reduce the cost of een la! tos at December 31, 2018 rd 2017re is lollows usand Gearing ratio The Company finances its operations through equity, borrowings and management of working capital with a view to maintaining an appropriate mix between various sources of finance, Note 2018 2017 [Rupees in thousand) CASH AND CASH EQUIVALENTS 15 1.114,816 347,558 Cash and bank balances Short term borrowings - running finance under mark-up arrangements 1938,992] 175,822 1583,741) 1236,183) PROPOSED AND DECLARED DIVIDENDS At the Board of Directors meeting held on February 28, 2019. a final dividend of Rs. 76 per stare amounting to Rs. 484, 12 million in respect of 2018 is proposed (2017: Rs. Nit per share amounting to Rs Nil. This is in addition to the cumulative interim cash adend of Rs. 20per share amounting to Rs 1.777 million (2017: Rs. 205 per share amounting to Rs. 1,262 miibon) declared during the year. CORRESPONDING RIGURES Corresponding figures have been rearranged and reclassified, wherever considered necessary and to comply with the requirements of Companies at 2017 DATE OF AUTHORISATION These financial statements were authorzed teressen Feb 28.39 by the Board of Directors of the Company Director and there once Share Capital Reserves Total kad, Fiscribed and and up cap Capital Revenue Sun Somiat Genel Premium appropriate Profil Ruped in the 61,576 24,000 128 94.499 Balance as at January 01. 2018 Total comprehensive income for the year ended 31 December 2018 181170 to the year de Decemser 31, 2018 11731,570 1.734.970 Other comprehensive income for the war ended December 31, 2018 1.731.392 1731.57 intended to the yearended December 2005 share 18135508 Secenelerinden for the year ended Dec 2011 Reperare 280278 December 31, 2018 Repare WEIGHTED AVERAGE COST OF CAPITAL 1. Prepare an excel spreadsheer that will: Compute a firm's weighted average cost of capital. ti. Determine how much financing will come from the various component sources, iii. Split common equity into internal and external components and adjust the weighted average cost of capital of various levels of internal equity availability. iv. How can the Capital Asset Pricing Model (CAPM) I used to estimate the cow of capital for a real investment decision? hint: Rr- BRR. 2 You will need the following inpxit cells: Par value of hoods ii. Coupon rate paid by bonds Time to maturity of bonds Price of bunds Preferred stock dividend (Dy) vi Preferred sock price (P1) Preferred stock fotution costs (1) Vit. Current common stock dividend (D: Common stock price (Po) Common stock prowth rate si Corunon stock fotation cost (1:) xint Total amount of financing needed si Internal equity valable X Capital structure Idebt, preferred stock and cummun stock) KPMG Taseer Hadi & Co. as the Auditors of the Company for the year 2019, subject to Shareholders' approval at the next AGM to be held on April 09, 2019. Holding Company Through its wholly owned subsidiary Conopco Inc, USA Unilever NV Netherlands, as a holding of 76,5% of the share in UPFL, and the Company's ultimate parent compary Subsequent Events No material changes and commitments affecting the financial position of the Company have oppurred between the end of the financial year and the date of this report. Reserve Appropriations Share Capital Reserves Total muscribe paid up empt Capital Revenue Shaw Special General UR Premium propre Pro Rupees in the sand Balance as at January 01, 2018 61.578 24,630 628 139 94498 181470 Total comprehensive income for the year ended 31 December 2018 -Profit for the year ended December 31, 2018 1.731,970 1,731,320 Other comprehensive income for the year ended December 31, 2018 27 27 1731.397 1731527 Tas, 550 First Interim didend for the year ended December 31, 2018 Rs 105 per share 1280,2780 1280.270 Second Interim dividend for the year ended December 31, 2018 @ Rs 44 perahu 13303171 1350,367 Third Interim dividend for the year ended December 31, 2018 Rs 55 per issue of night shanes 23.492 1271869 613.699 B 1296299 129 5. Balance as at December 31, 2018 1.109.99 Acknowledgement Our people are the key drivers behind the sustained growth of UPFL The directors acknowledge the contribution of each employee of the Company. We would also like to express our thanks to our customers for the trust shown in our products. We are also grateful to our shareholders for their support and confidence in our management. Future Outlook Despite challenging economic and operating environment, the business has continued to deliver positive results. We are committed to deal with the challenges that he ahead with our access to global expertise, superior connes undertanding, portul innovations and world is customer service. We believe that our dedicated and focused effortsatt provide better value to meet consumers meryday needs and deliver sustained profitable growth for the benefit of a Stakeholders Thanking you all On behou of the Board ron Mirra Shana sud Che Statement of Financial Position Horizontal Analysis for 6 years MLM 2018 19 Re. 2012 17. PIOE *** DTS NEW KILDE 20 A. 2012 RE R. EQUITY AND LIABILITIES Capital and reserves MENE BUBTN Share capital eserves NA HL 1,044,10 1,104, TATLON MURT EEN LAW 11.10 on. NEM RELIA MOON IN DR TOIT MEN IGNAC REN FEME TATO W CEE AIN Non-current abilities UND Stiinement benefits Delete con IMME 313.70 163 16.000 TO 1.NO 2012 AM IN BALE CREA war MET W THEM RE MELON al 2110 HA) AM NOW 1122 1.ME Current liabilites Trade and operates DIA LAKET LLERIET 4623 2. EM BILM WOMAN 3.634 INGUR 97,43 D COLE IM WING DEP ALAM NES 12 M - / -- NE 15.00 791 INFO CIMB GO el TODA TO Short borrow 1 100.00 780741 s ta DI 1100 112 BE TI CE 2.1 CE IN 16 42 am 0 2012 110 2.NA 17 EM LI BE Am 24 ASSETS on-cotenta sets Desperti pendeuren BUNUN 24 1.99 1 MON OL LE 13.203 ME 200 ml AR mi Long term toons and advances Songtemps and present rents 1.400 4,05 bar N 9 4 TH IA DOT ULTES MEER HEN H 12 N RA WE GE AN I 4.33 ons and advance ME - LA 44 DEN 34 . 10000 LEH PREM M . Statement Financapon Analysis C Statement of Financial Position Vertical Analysis for 6 years Penthousandl 2013 2013 2 RE EQUITY AND LIABILITIES Capitaland reserves NE 13 HT TEN Searcanica Ha NEE NE ETA EJE 2303 BU Non current abilities 0.13 2.35 60 Current liates UTET ZA UT NE RE To ASSETS SALE an TE LA WE MS Profit or Loss Account and Other Comprehensive Income Horizontal Analysis for 6 years 2010 Ru 18 V. 2017 17. KO 2016 Au. 16 V8. 15 2015 157.14 14 7:12 IR in thousand 2933 12.12 AM SMS 11.30 1073 10,745,250 18.50 1466,836 10.45 4571,091 10.07 7,787,059 11.90 6956,866 18.73 Cost of Ano 10.41 15.211.6N] 122132164,421 1110 IATO3.00 704 14.425,7071 7.27 14.05.2008 11.57 Gross proht 6,35,302 10.88 4,833.560 1502412.215 9.65 3.832.213 140 3360,070 15.58 2,907,564 30.39 Diserbution Cost (2.42 12 12.647.3201 10.12.233.100 125 11.754.0228 33.13 1.455,7700 17.30 11.20 Administrative penses 315,392) 419 1362756 *5.15 1155,137 115428 14.01 1180.740) (156,4728 5.09 one persing expenses 1142.0141 2.76 OL 1125.37 [127.2133 7.80 [115.8571 1945 Other Income 12.115 86.72 202.721 68.49 103,174 113.562 56.56 72.549 (1729 Profitrom operations 2171 3137 12.15 1.939.772 1512 142018 36 38 Finance costs 167.18751 16 26.01.201 24:50) 138,090 122.5.2) 149,2931 450.62 17.043) 12.11 Prat Debretion 2,46 23 1.720,706 3.65 1.772 1.805.68 11.43 1,68022 15.01.09 38.53 Taxanion 1780.1461 1565.03.31 1692 1491.669) 1433.5591 118,321 1518,168 1285 1459.100 33.77 Protteration ITULO 2773 1.355,073 1.776.GA 393 121130 5.15 1.121821 18 1,004999 37.80 Omer comprar name/ 2 100 541 1912 (42734 15:25 [134.49) 142113591 1008 (185.90 L. 1753 230.851 Tomprehensive income 1.73 20.30 1.350.601 573 270.014 1.227.797 88 1.121 30 1,001,500 1752 Vertical Analysis for 6 years thousand 2011 20 2015 R RE Sal DO 200 100.00 700.00 00.00 WEZO 10000 00.00 O. SA 15.0 254 1! 155 40 562 454 3.54 132 sono 10 2. D C 02.02.2010 Del 12 IS 2250 3 2127 Ha 42 1900 12.00 Operating TEAMN 11 IT. com 2. 10 2. rom 25197 2 10 4 an an . LUT - Pattern of Shareholding As at December 31, 2018 Number of Shareholders Shareholdings Stad Total Shared 480 101 10 15 to to to to 16 to to 2 2 2 3 2 1 1 1 1 1 101 501 1,001 5.001 10,001 25,001 35,001 45,001 50,001 60,001 65,001 75,001 80,001 95,001 115,001 125,001 135,001 4,875,000 to to 100 500 1,000 5.000 10,000 15,000 30,000 40,000 50,000 55,000 65,000 70,000 80,000 85,000 100,000 120,000 130,000 140,000 4,880,000 20,487 19.256 11.692 29,14 24.617 25,150 59,750 75,086 145.816 108.096 63,795 69 500 78.524 80.344 298,058 117,786 129,028 139,515 4.876.296 6.369.950 to to to to to 1 to 1 1 to 1 841 to to Categories of Shareholders Number of Shareholders Number of Shares Held Parcentage Associated Companies, undertakings and related parties 4,876 296 76.55 Directors, CEO and their spousels) and minor children 12 196.970 6.23 PubSector Companies and Corporations 2 Banks, development finance institutions, e banking finance companies, insurance companies, takaful, modarabas and pension funds 2 1.107 B06 093.238 2.00 Foreign companies 23 0.00 10 39.95 Statement of Financial Position As at December 31, 2018 Note 2018 2017 Rupees in thousand ASSETS Non-current assets 5 2 Property, plant and equipment angible assets Lone term deposit and pressment Long term loans and dances 81,637 7,783,569 81,637 2.980 11,338 7879,504 exy 13,205 2,087,816 rent assets Stores and spars Stock in de e e-4 Frasie depossa shorterarepments Other secera 1993 Statement of Financial Position As at December 31, 2018 Note 2018 2017 [Rupees in thousand) EQUITY AND LIABILITIES Share capital and reserves Share capital Reserves 16 17 43,699 1,846, 185 1,909,884 61,576 119,894 181,470 LIABILITIES Nonent liabilities Staff retirement bene its Deferred taxation 18 19 14,000 141.590 155,590 9345 203,785 213.130 Current liabelitres Trade adeher Pyables 20 2,835,390 21.310 2,773,124 Undaimes divadend 3 30653 Accessed interest mark up Siestas pate Shorter barns 22 3.89978 The snazed rotes to an integral part of these financial statement Statement Profit or Loss and Other Comprehensive Income For the year ended December 31, 2018 Note 2018 2017 IRupees in thousand) - SIN 24 11,898,200 10,745,260 Cost of sales 25 16,539,088) 15,911,896) Gross profit 5,359,342 4,833,564 Distribution cost 26 12,682,6581 12,649,320) Admistratwe expenses 22 1315,3921 1302.756) the operating expenses 1142,016) 1137.523) Other income 29 1322, 115 202.771 2,561,391 1,946,726 169,475) 126,0201 Profit before taxation 091716 1920.706 1760,146 1555,033) 1,731,50 0355,673 tems that will not be reclassified to profit or loss glamentais benefits testions 17.1021 12.10 1992) 2 Hems that may be subsequently teclassified competence 1390 MS Dees for resisrestate gesit Entre Statement of Cash Flows For the year ended December 31, 2018 2018 2012 Rupees in thousand Cash flows from operating activities Proft before taxation 2.491718 1,920,708 166417 Adjustments for non-cash charges and other items Depreciation Gain on disposal of property, plant and equipment Provision for staff retirement benefits Provision for impairment of fixed assets Mark-up on short term borrowings Retum on savings accounts 3,052 22.187 169,067 1200) 4694 89,000 54,278 16,537) 310.8.42 2,802,55 14,268 (17,611) 186,288 2,106,994 Effect on cash flows due to working capital changes Decrease increasele current assets Stores espres Stock arade Trade dents sans and advances de Deports and short term prepayments tax refundable 140170 149,571 1136 838) (13,6091 108 170,5211 1923) 0628 182,413 122 100.9252 (10517] 18331) (192784 creascrease in currenties rade noches payables 28 122 Stax payable 357240 3.036 199,999 266 207 155 Cenerated from operations de tonal TA 1758 Statement of Cash Flows For the year ended December 31, 2018 Note 2018 2017 (Rupees in thousandl Cash generated from operations brought forward) 2,753, 776 2,175,487 (13,175) 11,038,698) Mark-up paid Income tax paid Staff retirement benefits - contributions paid Long term deposit and prepayment Decrease/Increase) in long term loans Net cash from operating activities 111,975) (278,214) (3,291) 2,805 1903) 1,883,709 12,980) 1,867 1,670,790 Cash flows from investing activities Purchase of property, plant and equipment Proceeds from disposal of property, plant and equipment Return received on savings accounts 194,702) (1,029,442) 260 6,537 17,611 Net cash used in investing activities 11,042,445) 197,091) Cash flows from financing activities Proceeds from issue of right shares Dividends paid 1,273,992 11,190, 732) 1216,340 41205 Net increase / decreasel in cash and cash eguralents 12,737,580 12,737 680 1930,982) Cash and cash equivalents at beginning of the year 369 694,779 Cash and cash equivalents end of the year 126 1837 The annexed notes to formanntegral pathetics Shana Syed Chet Breuta Statement of Changes in Equity For the year ended December 31, 2018 SHARE CAME CAPITAL RESERVES RAVENUE TOTAL den MOTAAL There what we Hal theve Bences 1.2017 1.5 A 30 528 19 1717.146 Transactions with one or se empang 1,732 Fina disene for the year ended December 31, 21228 perware 211.814) 1211,819 121136) Tin Intem dividend for the year ended December 3132019 122 per share 1751.2211 17585229 Secres Intervieng for the year ended December 2013 50 pesh 1307.831) para Teans overensee December 31, 2018 Orare 12.03.2011 1209.2011 Total comprehensie income to the Per yere DE3117 year eno December 2011 630 2 BBC anted notes to the Chuo lalo na Orecto CHO Director Chile Gorice Operating assets Total brechen Felicias Piants Electrical Fume _thinery Chasiat ments and office equipment lupees in thousandl Neaming Water Tearded December 31, 2018 31231 Opening Ni Dio e NY Adations 06.185 20 Disposals Dest . 1570 . 14,795 Acomiated Depreciation WIRL provision for mpwd asses Disposals NBV Depreciation charge Ner charge of provision for mpamento ed asse Oleng NSV 12230 1187,071 187.0008 58 1583 1 172018 Oras Garning value bisas Al December 31, 2018 Dost 3.17 573 12.567 16.03 1.05 -2.7554 Provision for impactanter 11511 312 178,916 61,575 7,658 1956 121.709 114B 11:22391 1122151 1405 Accumulaned depreciation Going Nov 6,179 1,181,139 23 172 Net canning value basis de mer 31, 2017 Ona Not300 NEM Anational 179 49140 55.55 1 3.410 10 con Disposal NA nepog GO MS 114 Orang I At December 2017 - nova F 6.2 Capital Work in Progress - al cost 2018 2017 (Rupees in thousand) 86,465 Plant and machinery Cmil works Advances to suppliers 952 387 172,179 30,818 1,055,284 1,545 88,010 6.3 Particulars of immuable asset of the Company are as follows Address Usage of immovable property Manufacturing Plant Covered area sq ft 717300 sq feet Foods Factory S2KM, Multan Road, Phool Nagar. Tehsal Pattoki, District Kasur. Lahore NTANGIBLE ASSETS Gross carrying value bass 2017 (Rupees in thousand Cost Persementes restraint of trade 137,661 Reculated artization and mpairment Net blue The above represents amount paid for the acquisition of Glaxose DE 1999 Caxo Welcome Balestan Lente TR-Ghxckinepakistan Limitedl. De gement has assessed the seful life of the larg ble as ndetite se its expected to the undering and, lakbe, ali operate in the market for an indefinite penod of time For inspirant testing, the estimated severable amount has been determined using the discounted sth Basser period of years Kastamation usein estimation of recivezakte amount of Forests based on both internal and externet tarmont permanen dient bie The oceant rate used 1 034 217756 pre tax measure based on government bonds at The valisation exceeds the carrying and settiden sich that can hly poble ingen met ons LONG TERM DANSARSAVANCE Recorate with one year chico 8.1 2018 2017 Rupees in thousand Reconciliation of carrying amount of loans lo executives: - Opening balances - Disbursements - Repayments 20,003 9,892 (12,384 17,309 17,569 12.755 (10,301 20,003 Loans te employees have been provided to facilitate purchase of houses and vehicles in accordance with the Company's policy which are repayable over a period of five years and are interest free. The maximum aggregate amount of loans due from executives at the end of any month during the year was Re 100 million 2017 Rs. 22.91 milion STORES AND SPARES 2018 2017 (Rupees in thousand! 13,092 26,34 Soares includingin ang Rs. 1.01 milie, 2017: Rs 0.76 milli 38.923 57,033 12.990) Provision for obsolescence 37.688 12,220 35.446 Stores sparese. Nit (2017. Rs. Nu were written off during the year. XIN TRADE IRupee thousand and packing materials including in trang 72 73; 20Rs, 102.2 million 138627 5219 556 2022 1592993 589 14344 0245 cludeRS 77. 60 milionea with parties 102 The Company made provision of Rs. 10146 milion 2017 R$ 145 motor obscence and offertory Rs 50 milion 2011 Rs 55 milkie by utilizing the proudongth Note 2017 2018 (Rupees in thousand) 11. TRADE DEBTS Trade debts Less: Allowance for impairment of trade debts 11.1 536,952 127,664) 509,288 163,471 (24,704) 438,767 11.1 The Company has charged a provision of Rs. 2.96 million (2017: Rs. 0.90 million and has not written off any debtors during the year (2017: Na). 11.2 As of December 31, 2018, trade debts of Rs. 16.09 million (2017: Rs. 126.30 million) were past due but not impaired. These relate to a number of independent customers for whom there is no recent history of default. The age analysis of these trade debts is as follows: Note 2018 2017 (Rupees in thousand Up to 3 months More than 3 months to not later than 6 months More than 6 months 9.272 4623 16,095 112,516 8.206 3,579 126,301 12. LOANS AND ADVANCES - considered good 5,971 6,798 Current portion of loans to executives Advances to: executives other employees - Suppliers and others 121 864 331 59 13 13,0 164 155 45 509 12 en 12.1 The advance to executives are given to meet business expenses and are setsed as and when the expenses are incurred. Further the Company provides advance house rent to its employees Note 2018 Rupest 13 TRADE DEPOSITS AND SHORT TERM PREPAYMENTS Trade deposits Prepayments Prepad rerit 18.2 Plan assets held in trust are governed by local regulations which mainly includes Trust Act, 1882, Companies Act, 2017. Income Tax Rules, 2002. Employees Contributory Funds Investment in Listed Securities) Regulations, 2018 and Rules under the Trust deed of the Plan Responsibility for governance of the Plan, including investment decisions and contribution schedules, lies with the Board of Trustees. The Company appoints the trustees and all trustees are employees of the Company. 18.3 The latest actuarial valuation of the Fund as at December 31, 2018 was carried out using the Projected Unit Credit Method". Details of the Fund as per the actuarial valuation are as follows: Note 2018 2017 Funded Gratuity (Rupees in thousand] 18.4 Financial Position recondliation 18.5 Present value of defined benefit obligation at December 31 Fair valued plan assets at December 31 120,098) [35,158) 18.6 26,099 25,813 19,375 Movement in the present value of defined benefit obligation Balances as at January 1 Benefits paid by the plan Current service costs 11264 Remeasurement on obligation Balance as at December 31 3.925 2.900 11,8891 29,098 35.158 Movement in value of Iplafaase Fervalue of clansets at January Contributions paid into the plan Benefits and by the plan Interest income Berealiament ondan Fan value of planets at December 31 7.297 00 2018 2017 Funded Gratuit (Rupees in thousand 187 Expense recognised in statement of proht or loss Gument service costs Nel interest cost Expense recognised in statement of 0,925 2,985 269 67 profit or loss 4,892 13,052 18.8 Renzeurements recognisedin Other Comprehensive Income Eigenene loss ilgain) Remeasurement of fair value of plan assets Reneescrements 11.885) 1.846 (39) 5,032 2.100 7,132 Ne egne ability NetSabit aldavay1 Charge for the year Contebution made during the year 2,375 2694 2452 3,052 13,291 Remesurements regidin Other Comprehenstre income Recognised ability asset 139) 7.132 14,000 23.5 Please conseille wag: Genes SE Sang 2012 1295 MO 90 12 OSO 6, 201 6,54 Dior Copy 262 TE 25.913 09 Dentes de emergi 25 2 1.00% 18.16 The expected return on plan assets is based on the market expectations and depends upon the asset portfolio of the Fund, at the beginning of the period, for returns over the entire life of related obligation 18.17 The Company's contributions towards the Rafhan Best Foods Superannuation Fund and Rafhan Best Foods Limited Employees Gratuity Fund for the year ended December 31, 2018 amounted to Rs. Na (2017: Ps 329 million 18.18 The weighted average duration of the defined benefit obligation is 142 years, Expected maturity analysis of undiscounted retirement benefit plans: Less than @wear Over Total 5 years At December 31, 2018 Between Between 1-2 years 2-5 years Rupees in thousand 1,861 7.162 Retirement benefit plans 202 24,311 30,536 18.19 The Company also operates a couple of defined contribution plans which receive fixed contributions. The expense recognised in the current year in relation to these contributions was Rs, 19.743 million (2017: Rs. 20.579 million DEFERRED TAXATION Note 2018 2017 Rupees in thousand Credit balance ansing in respect of: - accelerated tax depreciation allowance - amo
Step by Step Solution
There are 3 Steps involved in it

Get step-by-step solutions from verified subject matter experts