

Answered step by step
Verified Expert Solution
Question
1 Approved Answer
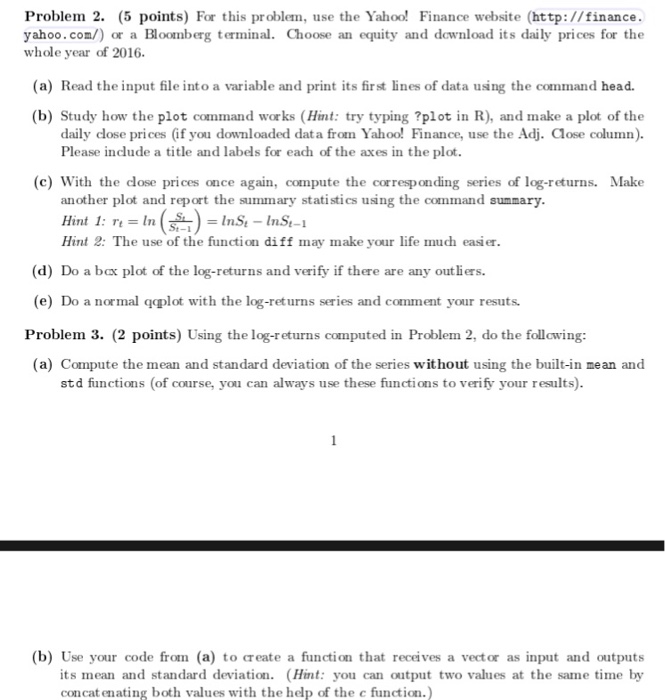
Financial Time Series For this problem, use the Yahoo! Finance website (http://finance yahoo.com/) or a Bloomberg terminal. Choose an equity and download its daily prices
 Financial Time Series
 Step by Step Solution
There are 3 Steps involved in it
Step: 1

Get Instant Access to Expert-Tailored Solutions
See step-by-step solutions with expert insights and AI powered tools for academic success
Step: 2

Step: 3
Ace Your Homework with AI
Get the answers you need in no time with our AI-driven, step-by-step assistance
Get Started
Catechism Of Money
Authors: Joseph P. Root
1st Edition
1377114929, 978-1377114927