

Answered step by step
Verified Expert Solution
Question
1 Approved Answer
Find five years of monthly returns for two mutual funds, Vanguard's U.S. Growth Fund and U.S. Value Fund, as well as corresponding returns for
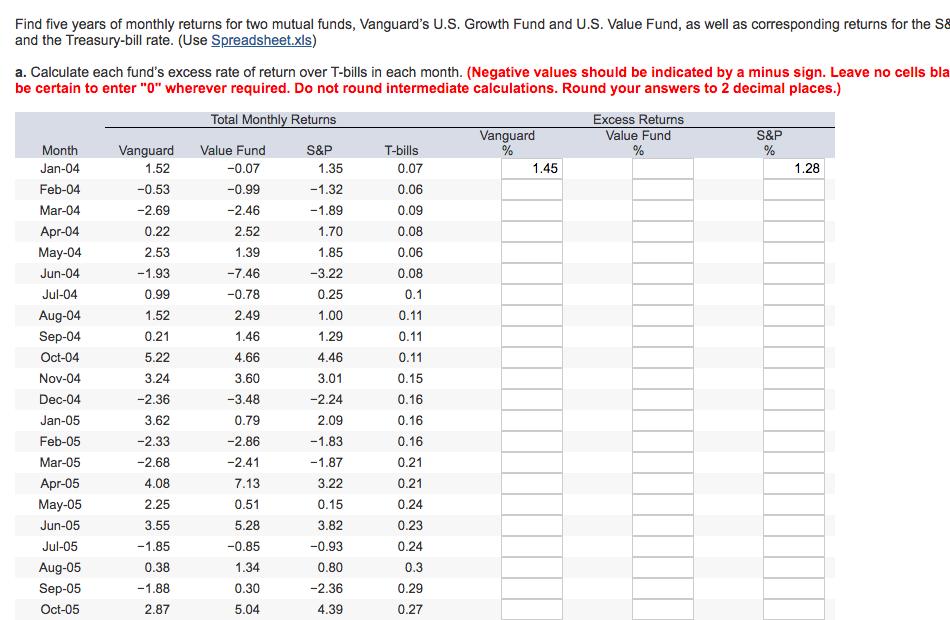
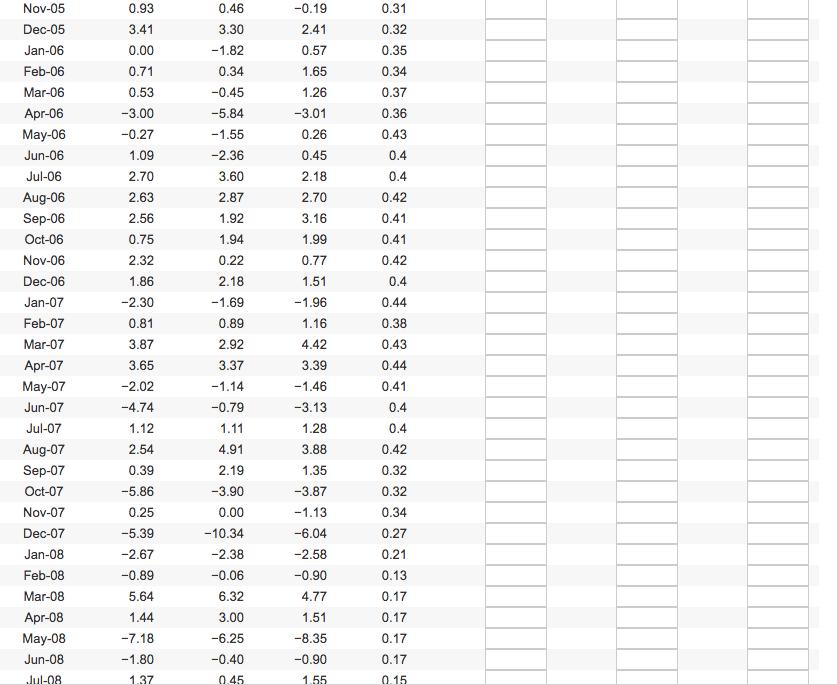
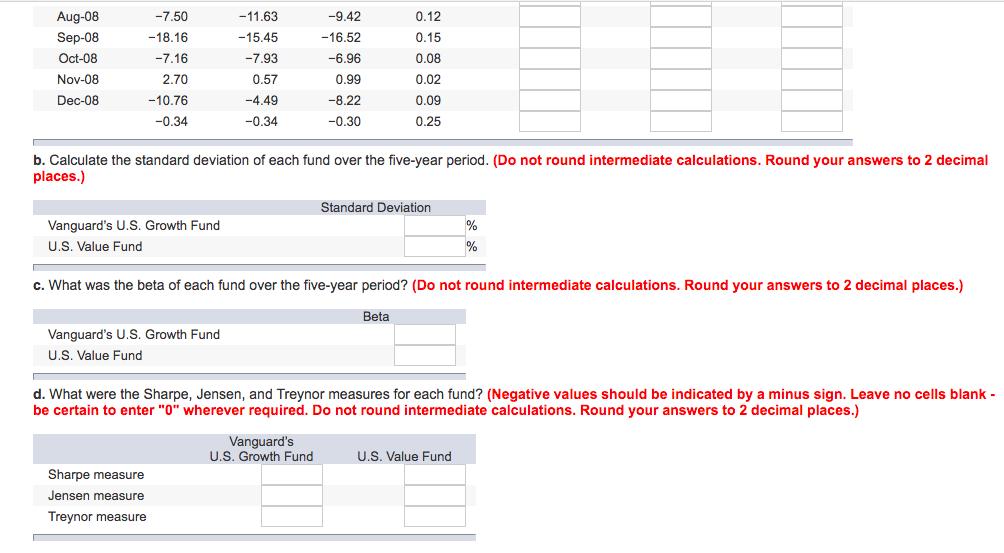
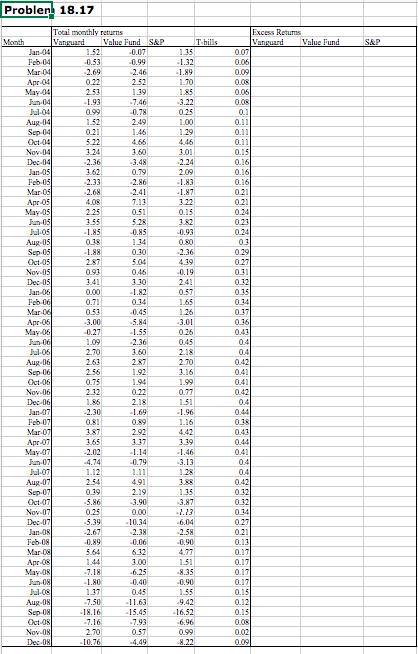
Find five years of monthly returns for two mutual funds, Vanguard's U.S. Growth Fund and U.S. Value Fund, as well as corresponding returns for the S& and the Treasury-bill rate. (Use Spreadsheet.xls) a. Calculate each fund's excess rate of return over T-bills in each month. (Negative values should be indicated by a minus sign. Leave no cells bla be certain to enter "0" wherever required. Do not round intermediate calculations. Round your answers to 2 decimal places.) Total Monthly Returns Excess Returns Vanguard % Value Fund % S&P % Value Fund S&P T-bills Month Jan-04 Vanguard 1.52 -0.07 1.28 Feb-04 -0.53 -0.99 Mar-04 -2.69 -2.46 Apr-04 0.22 2.52 May-04 2.53 1.39 Jun-04 -1.93 -7.46 Jul-04 0.99 -0.78 Aug-04 1.52 2.49 Sep-04 0.21 1.46 Oct-04 5.22 4.66 Nov-04 3.24 3.60 Dec-04 -2.36 -3.48 Jan-05 3.62 0.79 Feb-05 -2.33 -2.86 Mar-05 -2.68 -2.41 Apr-05 4.08 7.13 May-05 2.25 0.51 Jun-05 3.55 5.28 Jul-05 -1.85 -0.85 Aug-05 0.38 1.34 Sep-05 -1.88 0.30 Oct-05 2.87 5.04 1.35 -1.32 -1.89 1.70 1.85 -3.22 0.25 1.00 1.29 4.46 3.01 -2.24 2.09 -1.83 -1.87 3.22 0.15 3.82 -0.93 0.80 -2.36 4.39 0.07 0.06 0.09 0.08 0.06 0.08 0.1 0.11 0.11 0.11 0.15 0.16 0.16 0.16 0.21 0.21 0.24 0.23 0.24 0.3 0.29 0.27 1.45 Nov-05 Dec-05 Jan-06 Feb-06 Mar-06 Apr-06 May-06 Jun-06 Jul-06 Aug-06 Sep-06 Oct-06 Nov-06 Dec-06 Jan-07 Feb-07 Mar-07 Apr-07 May-07 Jun-07 Jul-07 Aug-07 Sep-07 Oct-07 Nov-07 Dec-07 Jan-08 Feb-08 Mar-08 Apr-08 May-08 Jun-08 Jul-08 0.93 3.41 0.00 0.71 0.53 -3.00 -0.27 1.09 2.70 2.63 2.56 0.75 2.32 1.86 -2.30 0.81 3.87 3.65 -2.02 -4.74 1.12 2.54 0.39 -5.86 0.25 -5.39 -2.67 -0.89 5.64 1.44 -7.18 -1.80 1.37 0.46 3.30 -1.82 0.34 -0.45 -5.84 -1.55 -2.36 3.60 2.87 1.92 1.94 0.22 2.18 -1.69 0.89 2.92 3.37 -1.14 -0.79 1.11 4.91 2.19 -3.90 0.00 -10.34 -2.38 -0.06 6.32 3.00 -6.25 -0.40 0.45 -0.19 2.41 0.57 1.65 1.26 -3.01 0.26 0.45 2.18 2.70 3.16 1.99 0.77 1.51 -1.96 1.16 4.42 3.39 -1.46 -3.13 1.28 3.88 1.35 -3.87 -1.13 -6.04 -2.58 -0.90 4.77 1.51 -8.35 -0.90 1.55 0.31 0.32 0.35 0.34 0.37 0.36 0.43 0.4 0.4 0.42 0.41 0.41 0.42 0.4 0.44 0.38 0.43 0.44 0.41 0.4 0.4 0.42 0.32 0.32 0.34 0.27 0.21 0.13 0.17 0.17 0.17 0.17 0.15 Aug-08 -7.50 -11.63 -9.42 0.12 Sep-08 -18.16 -15.45 -16.52 0.15 Oct-08 -7.16 -7.93 -6.96 0.08 Nov-08 2.70 0.57 0.99 0.02 Dec-08 -10.76 -4.49 -8.22 0.09 -0.34 -0.34 -0.30 0.25 b. Calculate the standard deviation of each fund over the five-year period. (Do not round intermediate calculations. Round your answers to 2 decimal places.) Standard Deviation Vanguard's U.S. Growth Fund % % U.S. Value Fund c. What was the beta of each fund over the five-year period? (Do not round intermediate calculations. Round your answers to 2 decimal places.) Beta Vanguard's U.S. Growth Fund U.S. Value Fund d. What were the Sharpe, Jensen, and Treynor measures for each fund? (Negative values should be indicated by a minus sign. Leave no cells blank - be certain to enter "0" wherever required. Do not round intermediate calculations. Round your answers to 2 decimal places.) Vanguard's U.S. Growth Fund U.S. Value Fund Sharpe measure Jensen measure Treynor measure Problen! 18.17 Month Jan-04 Feb 04 Mar 04 Apr 04 May 04 Jun-04 Jul-04 Aug-04 Sep 04 Oct-04 Nov 04 Dec 04 Jan-05 Feb 05 Mar 05 Apr 05 May 05 Jun-05 Jul-05 Aug-05 Sep-05 Oct-05 Nov 05 Dec 05 Jan-06 Feb 06 Mar 06 Apr 06 May 06 Jun-06 Jul-06 Aug-06 Sep 06 Oct-06 Nov 06 Dec 06 Jan-07 Feb 07 Mar 07 Apr 07 May 07 Jun-07 Jul-07 Aug-07 Sep-07 Oct-07 Nov 07 Dec 07 Jan-08 Feb 08 Mar-08 Apr 08 May-08 Jun-08 Jul-08 Aug-08 Sep-08 Oct-08 Nov 08 Dec 08 Total monthly returns Vanguard 1.52 -0.53 -2.69 0.22 2.53 -1.93 0.99 1.52 0.21 5.22 3.24 -2.36 3.62 -2.33 -2.68 4.08 2.25 3.55 -1.85 0.38 -1.88 2.87 0.93 3.41 0.00 0.71 0.53 -3.00 -0.27 1.09 2.70 2.63 2.56 0.75 1.86 -2.30 0.81 3.87 3.65 -2.02 -4.74 1.12 2.54 0.39 -5.86 0.25 5.39 -2.67 -0.89 5.64 1.44 -1.80 1.37 -7.50 -18.16 -7.16 2.70 -10.76 Value Fund S&P -0.07 -0.99 -2.46 2.52 1.39 -7.46 -0.78 2.49 1.46 4.66 3.60 -3.48 0.79 -2.86 -2.41 7.13 0.51 5.28 -0.85 1.34 0.30 5.04 0.46 3.30 -1.82 0.34 -0.45 -5.84 -1.55 -2.36 3.60 2.87 1.92 1.94 0.22 2,18 -1.69 0.89 2.92 3.37 -0.79 1.11 4.91 2.19 -3.90 0.00 -10.34 -2.38 -0.06 6.32 3.00 -6.25 -0.40 0.45 -11.63 -15.45 -7.93 0.57 -4.49 1.35 -1.32 -1.89 1.70 1.85 -3.22 0.25 1.00 1.29 4.46 3.01 2.24 2.09 -1.83 -1.87 0.15 3.82 -0.93 0.80 -2.36 4.39 -0.19 2.41 0.57 1.65 1.26 -3.01 0.26 0.45 2.18 2.70 3.16 1.99 0.77 1.51 -1.96 1.16 4.42 3.39 -1.46 -3.13 1.28 3.88 1.35 -3.87 -1.13 -6.04 -2.58 -0.90 4.77 1.51 -8.35 -0.90 1.55 -9.42 -16.52 -6.96 0.99 8.22 T-bills Excess Returns Vanguard Value Fund 0.07 0.06 0.09 0.08 0.06 0.08 0.1 0.11 0.11 0.11 0.15 0.16 0.16 0.16 021 0.21 0.24 0.23 0.24 0.3 0.29 0.27 0.31 0.32 0.35 0.34 0.37 0.36 0.43 0.4 04 0.42 0.41 0.41 0.42 0.4 0.44 0.38 0.43 0.44 041 0.4 0.4 0.42 0.32 0.32 034 0.27 0.21 0.13 0.17 0.17 0.17 0.17 0.15 0.12 0.15 0.08 0.02 0.09 S&P
Step by Step Solution
★★★★★
3.46 Rating (162 Votes )
There are 3 Steps involved in it
Step: 1
b c d a Calculate the excess return of each fund over Tbills in each ...
Get Instant Access to Expert-Tailored Solutions
See step-by-step solutions with expert insights and AI powered tools for academic success
Step: 2

Step: 3
Ace Your Homework with AI
Get the answers you need in no time with our AI-driven, step-by-step assistance
Get Started
Investments Analysis and Management
Authors: Charles P. Jones
12th edition
978-1118475904, 1118475909, 1118363299, 978-1118363294