Answered step by step
Verified Expert Solution
Question
1 Approved Answer
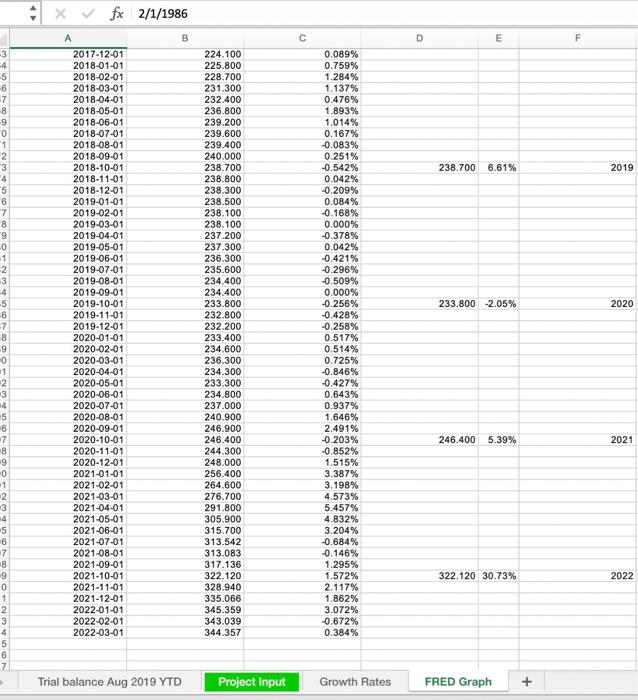
Find future producer price index/ inflation rates: is there a way to find the producer price index (2nd column) beyond 2022, from 2023 to 2050
Find future producer price index/ inflation rates:
-3 4 5 -6 7 8 -9 0 1 2 3 4 5 6 7 8 9 0 1 -2 -3 -4 -5 -6 -7 8 9 0 1 2 3 14 5 6 7 8 19 -0 1 2 3 4 5 -6 7 8 19 0 1 2 3 4 5 6 + x fx 2/1/1986 A 2017-12-01 2018-01-01 2018-02-01 2018-03-01 2018-04-01 2018-05-01 2018-06-01 2018-07-01 2018-08-01 2018-09-01 2018-10-01 2018-11-01 2018-12-01 2019-01-01 2019-02-01 2019-03-01 2019-04-01 2019-05-01 2019-06-01 2019-07-01 2019-08-01 2019-09-01 2019-10-01 2019-11-01 2019-12-01 2020-01-01 2020-02-01 2020-03-01 2020-04-01 2020-05-01 2020-06-01 2020-07-01 2020-08-01 2020-09-01 2020-10-01 2020-11-01 2020-12-01 2021-01-01 2021-02-01 2021-03-01 2021-04-01 2021-05-01 2021-06-01 2021-07-01 2021-08-01 2021-09-01 2021-10-01 2021-11-01 2021-12-01 2022-01-01 2022-02-01 2022-03-01 B Trial balance Aug 2019 YTD 224.100 225.800 228.700 231.300 232.400 236.800 239.200 239.600 239.400 240.000 238.700 238.800 238.300 238.500 238.100 238.100 237.200 237.300 236.300 235.600 234.400 234.400 233.800 232.800 232.200 233.400 234.600 236.300 234.300 233,300 234.800 237.000 240.900 246.900 246.400 244.300 248.000 256.400 264.600 276.700 291.800 305.900 315.700 313.542 313.083 317.136 322.120 328.940 335.066 345.359 343.039 344.357 Project Input C 0.089% 0.759% 1.284% 1.137% 0.476% 1.893% 1.014% 0.167% -0.083% 0.251% -0.542% 0.042% -0.209% 0.084% -0.168% 0.000% -0.378% 0.042% -0.421% -0.296% -0.509% 0.000% -0.256% -0.428% -0.258% 0.517% 0.514% 0.725% -0.846% -0.427% 0.643% 0.937% 1.646% 2.491% -0.203% -0.852% 1.515% 3.387% 3.198% 4.573% 5.457% 4.832% 3.204% -0.684% -0.146% 1.295% 1.572% 2.117% 1.862% 3.072% -0.672% 0.384% Growth Rates D 238.700 E 6.61% 233.800 2.05% 246.400 5.39% 322.120 30.73% FRED Graph + F 2019 2020 2021 2022 -3 4 5 -6 7 8 -9 0 1 2 3 4 5 6 7 8 9 0 1 -2 -3 -4 -5 -6 -7 8 9 0 1 2 3 14 5 6 7 8 19 -0 1 2 3 4 5 -6 7 8 19 0 1 2 3 4 5 6 + x fx 2/1/1986 A 2017-12-01 2018-01-01 2018-02-01 2018-03-01 2018-04-01 2018-05-01 2018-06-01 2018-07-01 2018-08-01 2018-09-01 2018-10-01 2018-11-01 2018-12-01 2019-01-01 2019-02-01 2019-03-01 2019-04-01 2019-05-01 2019-06-01 2019-07-01 2019-08-01 2019-09-01 2019-10-01 2019-11-01 2019-12-01 2020-01-01 2020-02-01 2020-03-01 2020-04-01 2020-05-01 2020-06-01 2020-07-01 2020-08-01 2020-09-01 2020-10-01 2020-11-01 2020-12-01 2021-01-01 2021-02-01 2021-03-01 2021-04-01 2021-05-01 2021-06-01 2021-07-01 2021-08-01 2021-09-01 2021-10-01 2021-11-01 2021-12-01 2022-01-01 2022-02-01 2022-03-01 B Trial balance Aug 2019 YTD 224.100 225.800 228.700 231.300 232.400 236.800 239.200 239.600 239.400 240.000 238.700 238.800 238.300 238.500 238.100 238.100 237.200 237.300 236.300 235.600 234.400 234.400 233.800 232.800 232.200 233.400 234.600 236.300 234.300 233,300 234.800 237.000 240.900 246.900 246.400 244.300 248.000 256.400 264.600 276.700 291.800 305.900 315.700 313.542 313.083 317.136 322.120 328.940 335.066 345.359 343.039 344.357 Project Input C 0.089% 0.759% 1.284% 1.137% 0.476% 1.893% 1.014% 0.167% -0.083% 0.251% -0.542% 0.042% -0.209% 0.084% -0.168% 0.000% -0.378% 0.042% -0.421% -0.296% -0.509% 0.000% -0.256% -0.428% -0.258% 0.517% 0.514% 0.725% -0.846% -0.427% 0.643% 0.937% 1.646% 2.491% -0.203% -0.852% 1.515% 3.387% 3.198% 4.573% 5.457% 4.832% 3.204% -0.684% -0.146% 1.295% 1.572% 2.117% 1.862% 3.072% -0.672% 0.384% Growth Rates D 238.700 E 6.61% 233.800 2.05% 246.400 5.39% 322.120 30.73% FRED Graph + F 2019 2020 2021 2022 is there a way to find the producer price index (2nd column) beyond 2022, from 2023 to 2050 to be exact. And the future inflation rates for it (5th column)?

Step by Step Solution
There are 3 Steps involved in it
Step: 1

Get Instant Access to Expert-Tailored Solutions
See step-by-step solutions with expert insights and AI powered tools for academic success
Step: 2

Step: 3

Ace Your Homework with AI
Get the answers you need in no time with our AI-driven, step-by-step assistance
Get Started


