

Answered step by step
Verified Expert Solution
Question
1 Approved Answer
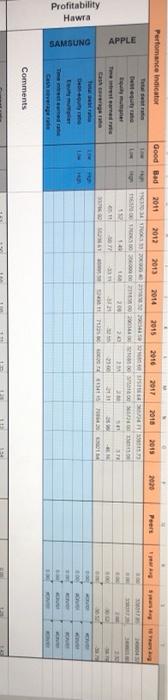
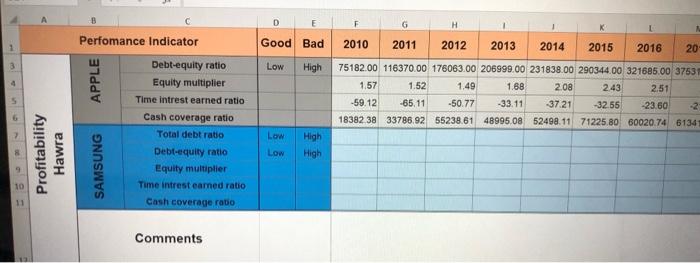
Find out what each ratio's definition is , understand it and type in what is a good ratio and what is a bad ratio; For
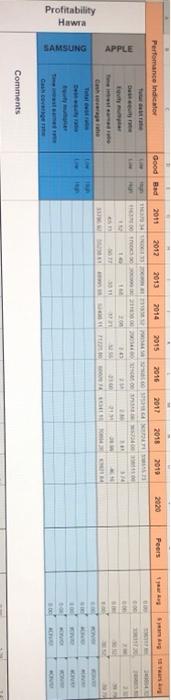
Find out what each ratio's definition is , understand it and type in what is a good ratio and what is a bad ratio; For example, A company has a good Inventory Turnover ratio if the ratio is a high number.
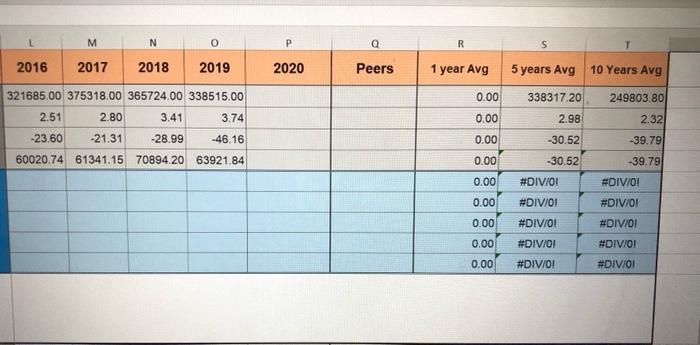
- Complete the ratio numbers for 2019 and 2020 for both Apple and Samsung.
- Summarize the data based on all the steps you did above in the comment part under your section. Try to analyze it too.
Find out what each ratio's definition is , understand it and type in what is a good ratio and what is a bad ratio; For example, A company has a good Inventory Turnover ratio if the ratio is a high number.
- Complete the ratio numbers for 2019 and 2020 for both Apple and Samsung.
- Summarize the data based on all the steps you did above in the comment part under your section. Try to analyze it too.
Find out what each ratio's definition is , understand it and type in what is a good ratio and what is a bad ratio; For example, A company has a good Inventory Turnover ratio if the ratio is a high number. - Complete the ratio numbers for 2019 and 2020 for both Apple and Samsung. - Summarize the data based on all the steps you did above in the comment part under your section. Try to analyze it too. you can search apple and samsung financial statements from Internet
Step by Step Solution
There are 3 Steps involved in it
Step: 1

Get Instant Access to Expert-Tailored Solutions
See step-by-step solutions with expert insights and AI powered tools for academic success
Step: 2

Step: 3
Ace Your Homework with AI
Get the answers you need in no time with our AI-driven, step-by-step assistance
Get Started
Fundamentals Of Financial Management
Authors: James C Van Horne
3rd Edition
0133393410, 978-0133393415