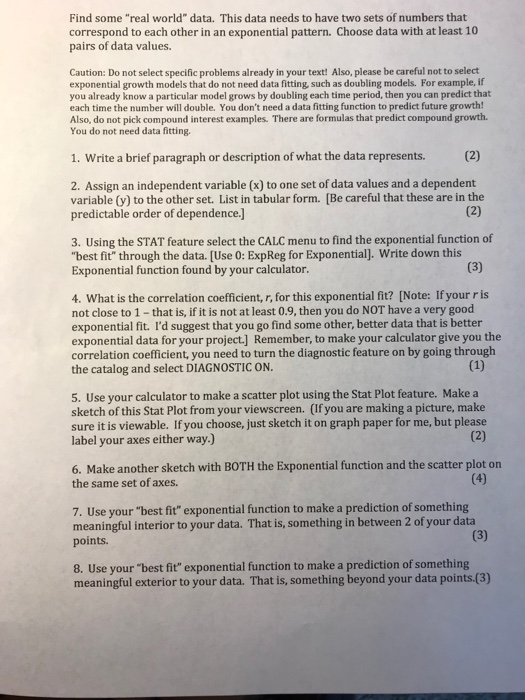
Question: Find some real world data. This data needs to have two sets of numbers that correspond to each other in an exponential pattern. Choose

Find some "real world" data. This data needs to have two sets of numbers that correspond to each other in an exponential pattern. Choose data with at least 10 pairs of data values. Caution: Do not select specific problems already in your text! Also, please be careful not to select exponential growth models that do not need data fitting, such as doubling models. For example, if you already know a particular model grows by doubling each time period, then you can predict that each time the number will double. You don't need a data fitting function to predict future growth! Also, do not pick compound interest examples. There are formulas that predict compound growth. You do not need data fitting. 1. Write a brief paragraph or description of what the data represents. 2. Assign an independent variable (x) to one set of data values and a dependent variable (y) to the other set. List in tabular form. [Be careful that these are in the predictable order of dependence.] (2) (2) 3. Using the STAT feature select the CALC menu to find the exponential function of "best fit" through the data. [Use 0: ExpReg for Exponential]. Write down this Exponential function found by your calculator. (3) 4. What is the correlation coefficient, r, for this exponential fit? [Note: If your ris not close to 1- that is, if it is not at least 0.9, then you do NOT have a very good exponential fit. I'd suggest that you go find some other, better data that is better exponential data for your project.] Remember, to make your calculator give you the correlation coefficient, you need to turn the diagnostic feature on by going through the catalog and select DIAGNOSTIC ON. (1) 5. Use your calculator to make a scatter plot using the Stat Plot feature. Make a sketch of this Stat Plot from your viewscreen. (If you are making a picture, make sure it is viewable. If you choose, just sketch it on graph paper for me, but please label your axes either way.) (2) 6. Make another sketch with BOTH the Exponential function and the scatter plot on the same set of axes. (4) 7. Use your "best fit" exponential function to make a prediction of something meaningful interior to your data. That is, something in between 2 of your data points. (3) 8. Use your "best fit" exponential function to make a prediction of something meaningful exterior to your data. That is, something beyond your data points.(3)
Step by Step Solution
3.48 Rating (158 Votes )
There are 3 Steps involved in it
To tackle this problem follow each step carefully Step 1 Find Real World Data Objective Collect at least 10 pairs of data values that exhibit an expon... View full answer

Get step-by-step solutions from verified subject matter experts


