Answered step by step
Verified Expert Solution
Question
1 Approved Answer
find the answer to 1,2,3-a, and 3-b there are at the bottom of the picture Current Yr 1 Yr Ago 2 Yrs Ago Simon Company's
find the answer to 1,2,3-a, and 3-b there are at the bottom of the picture 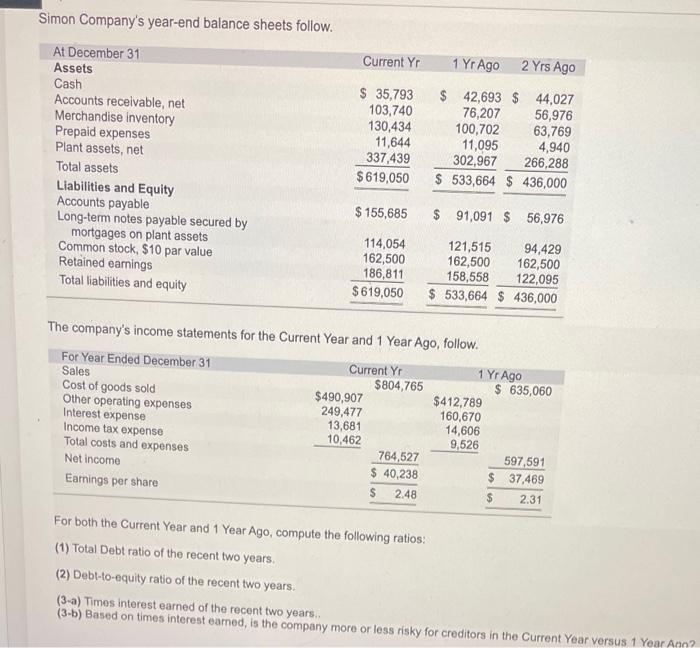
Current Yr 1 Yr Ago 2 Yrs Ago Simon Company's year-end balance sheets follow. At December 31 Assets Cash Accounts receivable, net Merchandise inventory Prepaid expenses Plant assets, net Total assets Liabilities and Equity Accounts payable Long-term notes payable secured by mortgages on plant assets Common stock, $10 par value Retained earnings Total liabilities and equity $ 35,793 103,740 130,434 11,644 337,439 $ 619,050 $ 42,693 $ 44,027 76,207 56,976 100,702 63,769 11,095 4,940 302,967 266,288 $ 533,664 $ 436,000 $ 155,685 $ 91,091 $ 56,976 114,054 162,500 186,811 $ 619,050 121,515 94,429 162,500 162,500 158,558 122,095 $ 533,664 $ 436,000 The company's income statements for the Current Year and 1 Year Ago, follow. For Year Ended December 31 Current YT 1 Yr Ago Sales $804,765 $ 635,060 Cost of goods sold $490,907 $412,789 Other operating expenses 249,477 160,670 Interest expense 13,681 14,606 Income tax expense 10,462 9,526 Total costs and expenses 764,527 597,591 Net income $ 40,238 $ 37,469 Earnings per share $ 2.48 $ 2.31 For both the Current Year and 1 Year Ago, compute the following ratios: (1) Total Debt ratio of the recent two years. (2) Debt-to-equity ratio of the recent two years. (3-a) Times interest earned of the recent two years. (3-6) Based on times interest eamed, is the company more or less risky for creditors in the Current Year versus 1 Year Ann Step by Step Solution
There are 3 Steps involved in it
Step: 1

Get Instant Access to Expert-Tailored Solutions
See step-by-step solutions with expert insights and AI powered tools for academic success
Step: 2

Step: 3
Ace Your Homework with AI
Get the answers you need in no time with our AI-driven, step-by-step assistance
Get Started