

Answered step by step
Verified Expert Solution
Question
1 Approved Answer
Aggregate volume and provider utilization trends Operating ratios, including expenses as a percentage of net operating revenue.Make sure costs such as labor, supplies and purchased
- Aggregate volume and provider utilization trends Operating ratios, including expenses as a percentage of net operating revenue.Make sure costs such as labor, supplies and purchased services remain in check.
- Patient revenue indicators.These include bad debt percentage and net to gross percentage by payer class. Are there shifts in payer mix that need to be addressed?
- Liquidity ratios.These include net days in patient accounts receivable and cash collections as a percentage of net revenue. What steps can be taken to improve cash flow?
- Labor costs relative to patient volume.Measure productivity in each department against department specific staffing targets as well as the overall FTE
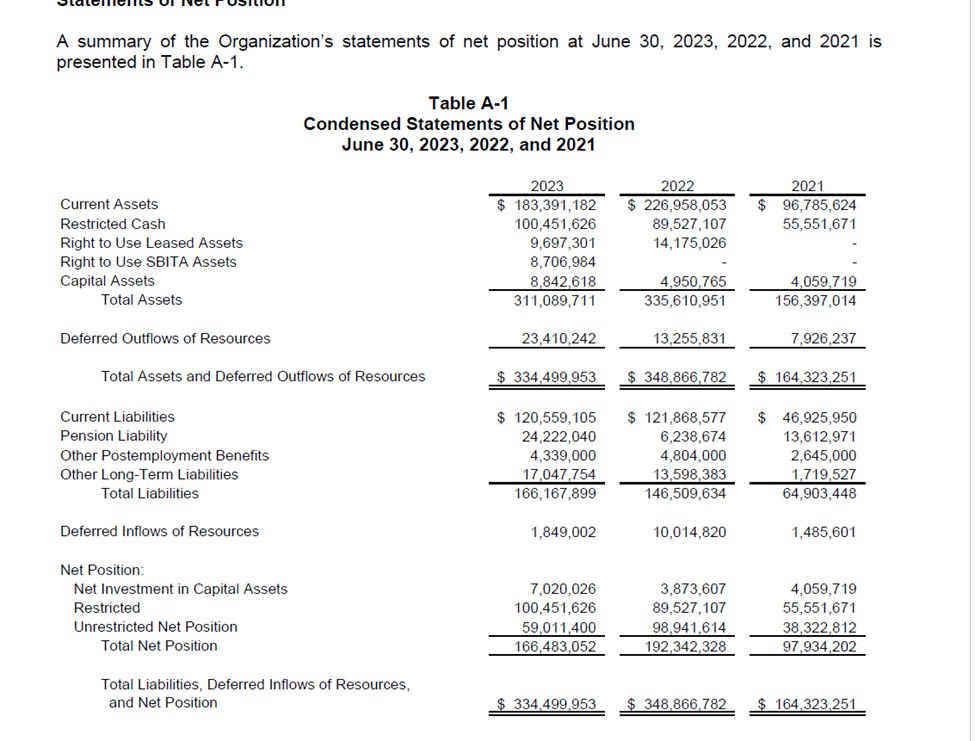
A summary of the Organization's statements of net position at June 30, 2023, 2022, and 2021 is presented in Table A-1. Current Assets Restricted Cash Right to Use Leased Assets Right to Use SBITA Assets Capital Assets Total Assets Deferred Outflows of Resources Table A-1 Condensed Statements of Net Position June 30, 2023, 2022, and 2021 Total Assets and Deferred Outflows of Resources Current Liabilities 2023 $ 183,391,182 100,451,626 9,697,301 2022 $ 226,958,053 89,527,107 14,175,026 2021 $ 96,785,624 55,551,671 8,706,984 8,842,618 311,089,711 23,410,242 $ 334,499,953 $ 120,559,105 24,222,040 4,339,000 4,950,765 335,610,951 13,255,831 $ 348,866,782 $ 121,868,577 6,238,674 4,804,000 4,059,719 156,397,014 7,926,237 $164,323,251 $ 46,925,950 13,612,971 2,645,000 Pension Liability Other Postemployment Benefits Other Long-Term Liabilities Total Liabilities Deferred Inflows of Resources Net Position: Net Investment in Capital Assets Restricted Unrestricted Net Position Total Net Position Total Liabilities, Deferred Inflows of Resources, and Net Position 17,047,754 13,598,383 1,719,527 166,167,899 146,509,634 64,903,448 1,849,002 10,014,820 1,485,601 7,020,026 3,873,607 4,059,719 100,451,626 89,527,107 55,551,671 59,011,400 166,483,052 98,941,614 38,322,812 192,342,328 97,934,202 $ 334,499,953 $ 348,866,782 $ 164,323,251
Step by Step Solution
There are 3 Steps involved in it
Step: 1

Get Instant Access to Expert-Tailored Solutions
See step-by-step solutions with expert insights and AI powered tools for academic success
Step: 2

Step: 3
Ace Your Homework with AI
Get the answers you need in no time with our AI-driven, step-by-step assistance
Get Started
Managerial Accounting
Authors: Ray H. Garrison, Eric W. Noreen, Peter C. Brewer
12th Edition
978-0073526706, 9780073526706