

Answered step by step
Verified Expert Solution
Question
1 Approved Answer
Find the answers using cell formulas. Show the cell formulas. Nothing is missing. Solve everything and show cell formulas used. thr picture is clearly visible.
Find the answers using cell formulas. Show the cell formulas. 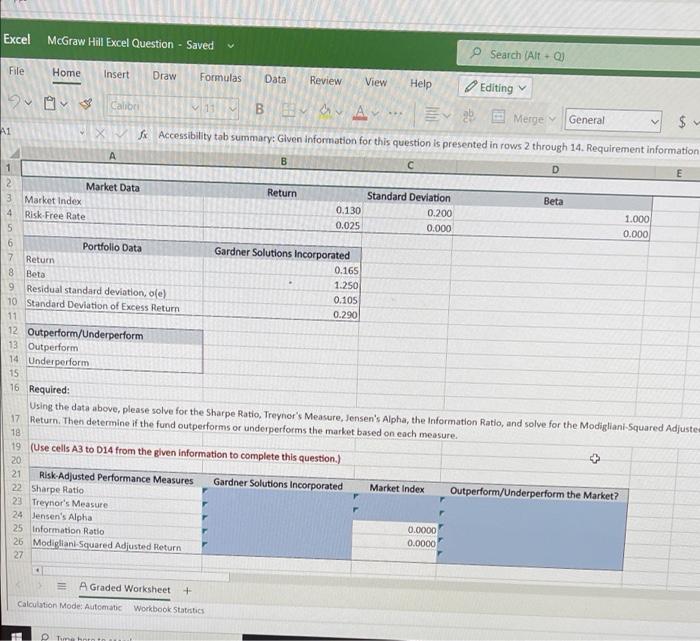
Nothing is missing. Solve everything and show cell formulas used. 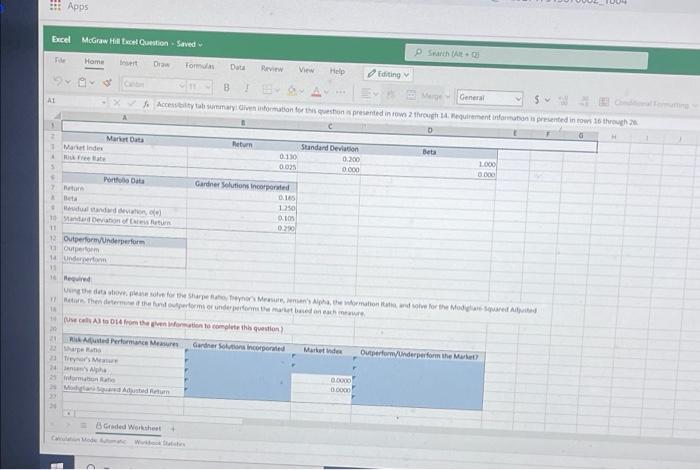
thr picture is clearly visible. please put on glasses. thank you 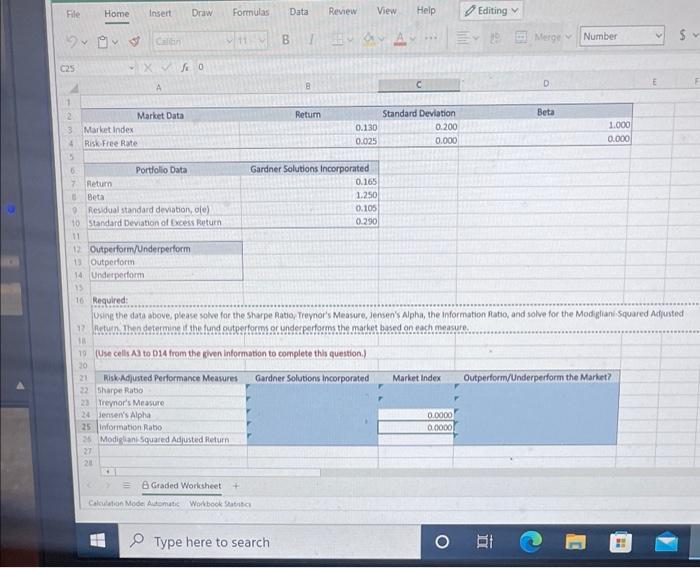
Excel McGraw Hill Excel Question - Saved Search (Alt. File Home Insert Draw Formulas Data Review View Help DAY Calibo Editing va Merge - General 1 B BY A $ A1 X fx Accessibility tob summary: Given information for this question is presented in rows 2 through 14. Requirement information B D E Market Data 3 Market Index Risk Free Rate Return Beta NONDON 0.130 0.025 Standard Deviation 0.200 0.000 1.000 0.000 Portfolio Data Gardner Solutions Incorporated Return 0.165 Beta 1.250 Residual standard deviation, ole) 0.105 10 Standard Deviation of Excess Return 0.290 11 12 Outperform/Underperform 13 Outperform 14 Under perform 15 16 Required: Using the data above, please solve for the Sharpe Ratio, Treynor's Measure, Jensen's Alpha, the Information Ratio, and solve for the Modigliani-Squared Adjuste 17 Return. Then determine if the fund outperforms or underperforms the market based on each measure. 18 19 (Use cells A3 to 014 from the given information to complete this question.) 20 21 Risk Adjusted Performance Measures Gardner Solutions Incorporated Market Index Outperform/Underperform the Market? 22 Sharpe Ratio 23 Treynor's Measure 24 Jensen's Alpha 0.0000 25 Information Ratio 0.0000 26 Modigliani-Squared Adjusted Return 27 + A Graded Worksheet + Calculation Mode: Automatic Workbook Statistics Tunnt to Apps Excel McGraw Hill Excel Question - Seved Search Home fomu Data R. View Hele Editing AL General Accettabommary Given information for en prentement informations presented in 16th D G Marietta Return Standard Deviation Beta Mantinde 0.110 0.200 2000 01025 0.000 0.000 Portfolite Gardner Solutions Incorporated 7 Batur 0.185 Beta 1.250 0.005 11 Sandbevont lutumn 0.29 11 12 Outperform/Underperform Om Under 19 1 the store for More 11 Return the determine performed A3 04 from the Woocomplete a question RM Performance Measure Gardner Solutions incorporated Marketinde Outperform/Under perform the Market pane M 0.0000 informatie Mand Antara 20 B Graded Worksheet+ File Home Insert Draw Formulas Data Review View Help Editing v V Number Galin 30 Merge 1 C25 B C D Beta 1 2 Market Data 3 Market Index Risk Free Rate Return 0.130 0.025 Standard Deviation 0.200 0.000 1.000 0.000 0 Portfolio Data Gardner Solutions Incorporated 7. Retum 0.165 Beta 1.250 Residual standard deviation, le) 0.105 10 Standard Deviation of Excess Return 0.290 11 12 Outperform/Underperform 1 Outperform 14. Underperform 15 16. Required: Using the data above, please solve for the Sharpe Ratio, Treynor's Measure, Jensen's Alpha, the information Ratio, and solve for the Modigliani Squared Adjusted 17 tuin. Then determine the fund outperforms or under performs the market based on each measure 1 19 (Use cells A3 to 034 from the piven information to complete this question.) 20 21 Risk Adjusted Performance Measures Gardner Solutions Incorporated Market Index Outperform/Underperform the Market? 32 Sharpe Ratio 23 Treynor's Measure 24 Jensen's Alpha 0.0000 25 Information Rabo 0.0000 2 Modigliani Squared Adjusted Return + 8 Graded Worksheet Calculation Model Automatic Workbook Type here to search BI Excel McGraw Hill Excel Question - Saved Search (Alt. File Home Insert Draw Formulas Data Review View Help DAY Calibo Editing va Merge - General 1 B BY A $ A1 X fx Accessibility tob summary: Given information for this question is presented in rows 2 through 14. Requirement information B D E Market Data 3 Market Index Risk Free Rate Return Beta NONDON 0.130 0.025 Standard Deviation 0.200 0.000 1.000 0.000 Portfolio Data Gardner Solutions Incorporated Return 0.165 Beta 1.250 Residual standard deviation, ole) 0.105 10 Standard Deviation of Excess Return 0.290 11 12 Outperform/Underperform 13 Outperform 14 Under perform 15 16 Required: Using the data above, please solve for the Sharpe Ratio, Treynor's Measure, Jensen's Alpha, the Information Ratio, and solve for the Modigliani-Squared Adjuste 17 Return. Then determine if the fund outperforms or underperforms the market based on each measure. 18 19 (Use cells A3 to 014 from the given information to complete this question.) 20 21 Risk Adjusted Performance Measures Gardner Solutions Incorporated Market Index Outperform/Underperform the Market? 22 Sharpe Ratio 23 Treynor's Measure 24 Jensen's Alpha 0.0000 25 Information Ratio 0.0000 26 Modigliani-Squared Adjusted Return 27 + A Graded Worksheet + Calculation Mode: Automatic Workbook Statistics Tunnt to Apps Excel McGraw Hill Excel Question - Seved Search Home fomu Data R. View Hele Editing AL General Accettabommary Given information for en prentement informations presented in 16th D G Marietta Return Standard Deviation Beta Mantinde 0.110 0.200 2000 01025 0.000 0.000 Portfolite Gardner Solutions Incorporated 7 Batur 0.185 Beta 1.250 0.005 11 Sandbevont lutumn 0.29 11 12 Outperform/Underperform Om Under 19 1 the store for More 11 Return the determine performed A3 04 from the Woocomplete a question RM Performance Measure Gardner Solutions incorporated Marketinde Outperform/Under perform the Market pane M 0.0000 informatie Mand Antara 20 B Graded Worksheet+ File Home Insert Draw Formulas Data Review View Help Editing v V Number Galin 30 Merge 1 C25 B C D Beta 1 2 Market Data 3 Market Index Risk Free Rate Return 0.130 0.025 Standard Deviation 0.200 0.000 1.000 0.000 0 Portfolio Data Gardner Solutions Incorporated 7. Retum 0.165 Beta 1.250 Residual standard deviation, le) 0.105 10 Standard Deviation of Excess Return 0.290 11 12 Outperform/Underperform 1 Outperform 14. Underperform 15 16. Required: Using the data above, please solve for the Sharpe Ratio, Treynor's Measure, Jensen's Alpha, the information Ratio, and solve for the Modigliani Squared Adjusted 17 tuin. Then determine the fund outperforms or under performs the market based on each measure 1 19 (Use cells A3 to 034 from the piven information to complete this question.) 20 21 Risk Adjusted Performance Measures Gardner Solutions Incorporated Market Index Outperform/Underperform the Market? 32 Sharpe Ratio 23 Treynor's Measure 24 Jensen's Alpha 0.0000 25 Information Rabo 0.0000 2 Modigliani Squared Adjusted Return + 8 Graded Worksheet Calculation Model Automatic Workbook Type here to search BI Step by Step Solution
There are 3 Steps involved in it
Step: 1

Get Instant Access to Expert-Tailored Solutions
See step-by-step solutions with expert insights and AI powered tools for academic success
Step: 2

Step: 3
Ace Your Homework with AI
Get the answers you need in no time with our AI-driven, step-by-step assistance
Get Started
Snap Judgment When To Trust Your Instincts When To Ignore Them And How To Avoid Making Big Mistakes With Your Money
Authors: David E. Adler
1st Edition
0137147783,0137037090