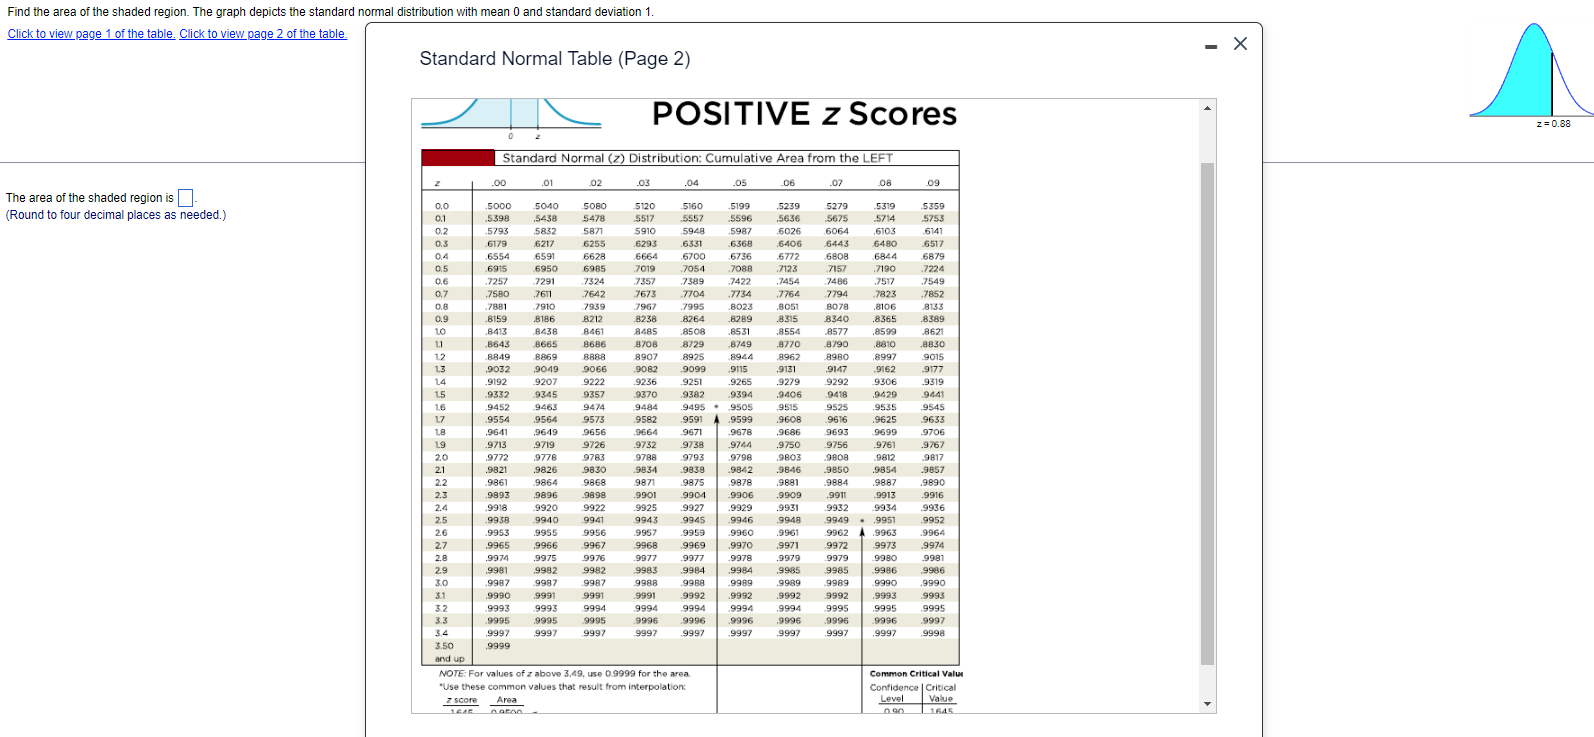
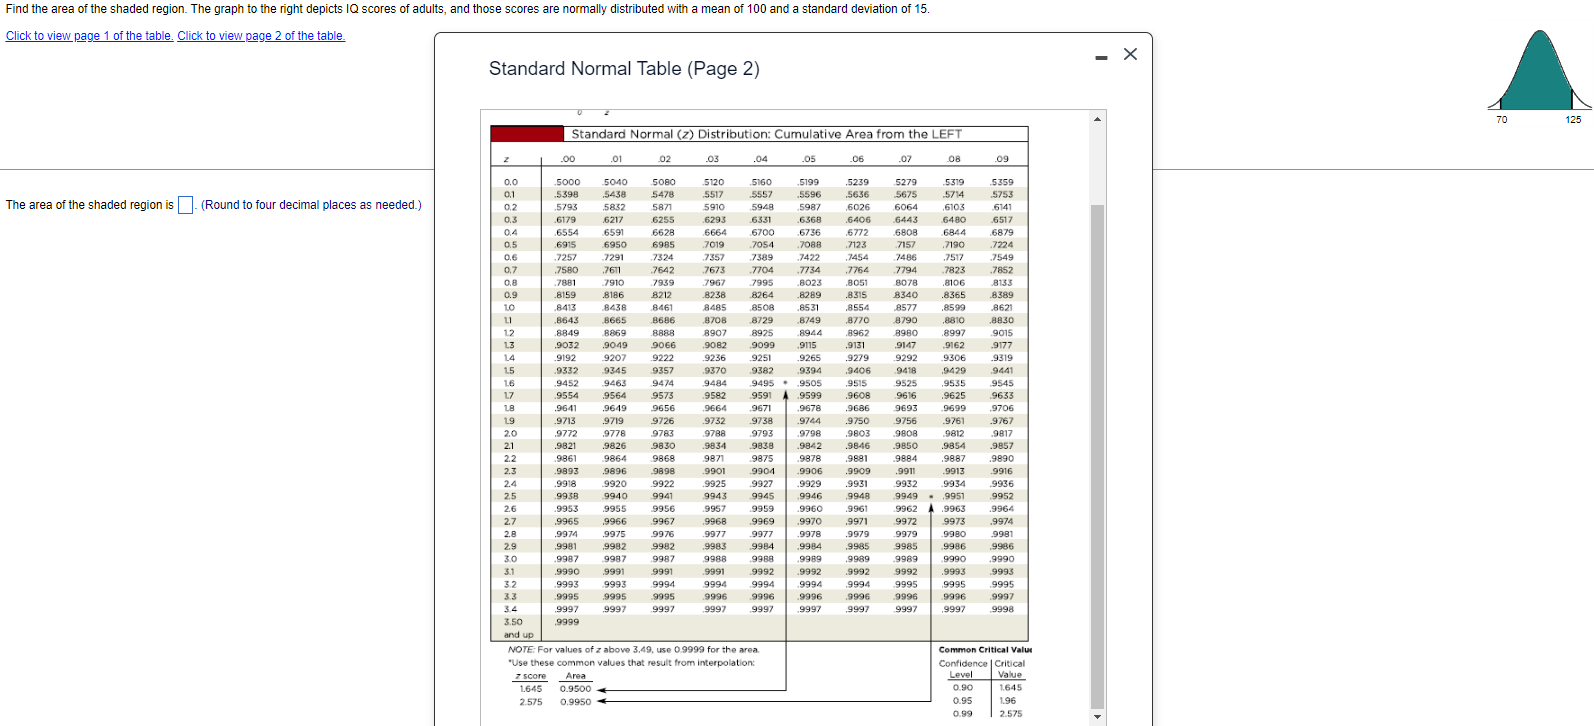
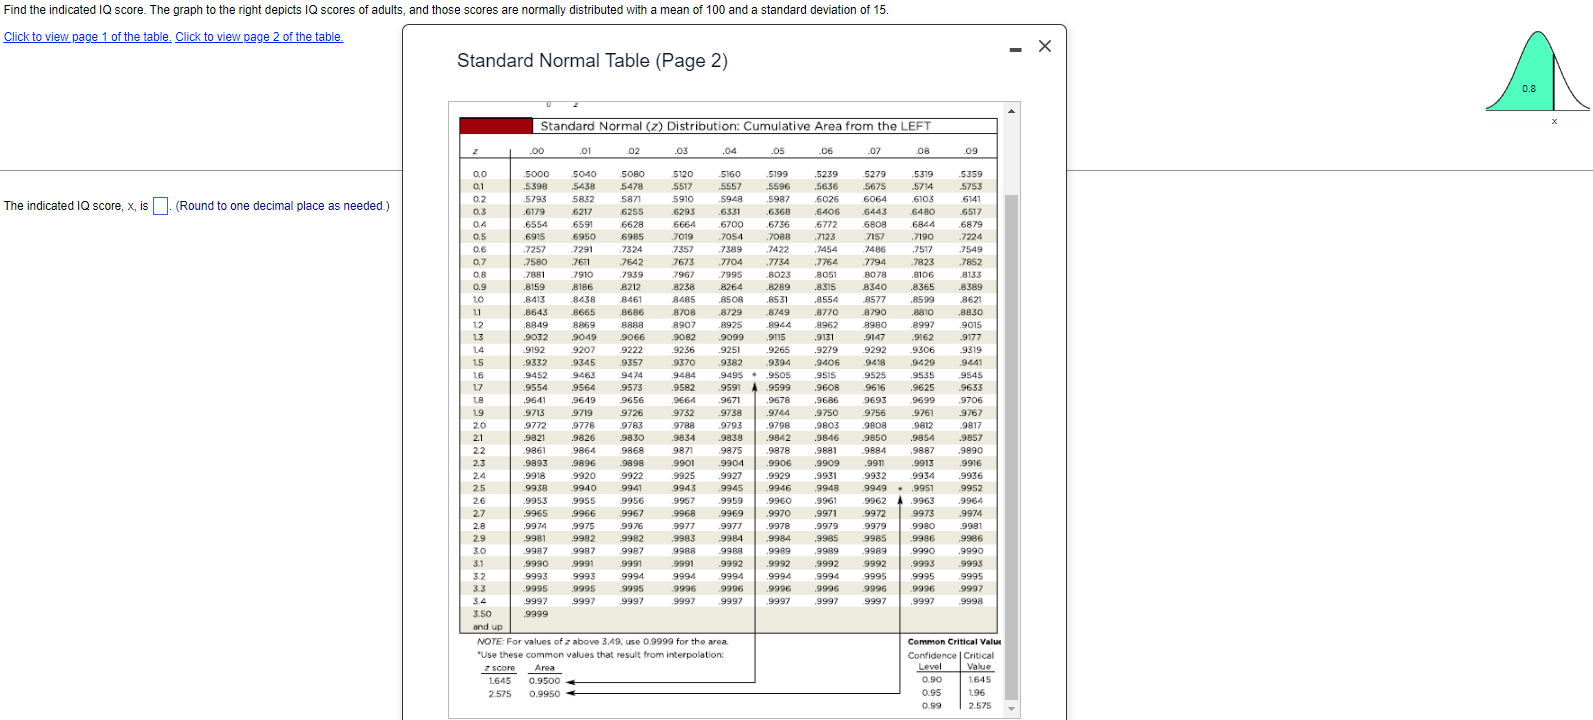
Find the area of the shaded region. The graph depicts the standard normal distribution with mean 0 and standard deviation 1. Click to view page 1 of the table. Click to view page 2 of the table. - X Standard Normal Table (Page 2) POSITIVE z Scores Z =0.88 Standard Normal (z) Distribution: Cumulative Area from the LEFT .00 .01 02 .03 .04 .05 .06 .07 08 .09 The area of the shaded region is]- 0.0 .5000 5040 5080 5120 5160 .5199 .5239 5279 .5319 5359 (Round to four decimal places as needed.) 5438 5478 5517 5557 5596 .5636 .5675 5714 5753 0,1 .5398 0.2 5793 5832 5871 5910 5948 5987 6026 6064 6103 6141 0.3 6179 6217 625 6293 6331 6368 6406 6443 6480 6517 6554 562 5664 6700 6736 6772 6808 5844 6879 0.4 6591 0.5 6915 6950 698 7019 7054 .7088 7123 7157 ,7190 7224 0.6 7257 7291 7324 7357 7389 7422 7454 7486 .7517 7549 0.7 ,7580 7671 7642 7673 7704 .7734 776 2794 7823 7852 8133 0.8 7881 7910 7959 7967 7995 .8023 8051 8078 ,8106 0.9 8159 8186 8212 8238 8264 8289 8315 8340 8365 8389 10 8413 3438 8461 8485 8506 8531 8554 8577 859 8621 11 8643 8665 3686 8708 8729 8749 8770 8790 ,8810 8830 12 8849 8869 388 8907 8925 8944 8962 3980 399 9015 13 .9032 9049 9066 9082 9099 .9115 .9131 9147 9162 .9177 14 9192 9207 9222 9236 9251 .9265 9279 9292 9306 .9319 15 9332 9345 9357 9370 9382 9394 9406 9418 9429 9441 16 .9452 9463 347 9484 9495 .9505 9515 9523 9535 9545 17 955 9564 957 9582 9591 .9599 9608 9616 9625 9633 LB 9641 9649 9656 9664 9671 9678 9686 9693 9699 9706 19 9713 9719 9726 9732 9738 974 9750 9756 9761 9767 20 9772 9778 9783 9788 9793 9798 9803 9808 9812 9817 21 .9821 9826 9830 9834 9838 9842 984 9850 985 9857 2.2 9861 9864 286 9871 9875 9878 9891 9884 988 9890 2.3 9893 9896 9901 990 9906 .9909 .991 9913 9916 2.4 9918 1920 992 9925 9927 9929 9931 9932 9934 9936 2.5 9938 9940 9941 9943 9949 9946 9948 9949 .995 9957 26 9953 9955 9950 9957 995 9960 9961 9962 .9963 996 2.7 .9965 9966 2967 9968 996 9970 9971 9972 997 9974 2.8 9974 9975 997 9977 9977 9978 .9979 9979 9980 9981 2.9 .9981 9982 998 9983 998 9984 .9985 9985 9986 9986 3.0 9987 9987 298 9988 9986 9989 9989 9989 9990 9990 3.1 9990 9991 9991 9991 9997 9992 9992 9997 999 9993 3.2 9993 9993 399 9994 999 9994 9994 9995 .9995 9995 33 .9995 9995 9995 9996 9996 9996 9996 9996 9996 9997 3.4 9997 999 9997 9997 9997 .9997 ,9997 9997 9997 9998 3.50 9999 and up NOTE: For values of z above 3.49, use 0.9999 for the area Common Critical Value Use these common values that result from interpolation: Confidence | Critical z score Area Level Value 0.90 1645Find the area of the shaded region. The graph to the right depicts IQ scores of adults, and those scores are normally distributed with a mean of 100 and a standard deviation of 15. Click to view page 1 of the table. Click to view page 2 of the table. X Standard Normal Table (Page 2) 70 125 Standard Normal (z) Distribution: Cumulative Area from the LEFT .00 .04 .06 08 .09 0.0 5000 5040 5080 -5120 5160 .5199 .5239 5279 .5319 5359 0.1 .5398 5436 5478 5517 5557 5596 5636 5675 5714 5753 The area of the shaded region is . (Round to four decimal places as needed.) 0,2 .5793 5832 5871 5910 5948 5987 6026 6064 6103 6141 0.3 6175 6217 6255 6295 6331 6368 6406 6443 6480 .6517 0.4 .6554 6591 6628 5664 6700 6736 6772 .6808 6844 6879 0.5 6915 695 6985 7019 7054 7088 /125 7190 7224 0.6 .7257 7291 7324 7357 7389 7427 ,7454 .7486 7517 7549 0.7 7580 7611 7642 7673 7704 7734 7764 7794 .7823 7852 0.8 .7881 7910 7939 7967 7995 8023 .8051 8078 8106 8133 0.9 .8159 8186 8212 8238 8264 8289 8315 8340 8365 8389 LO 8413 843 8461 348 8508 8531 8554 8577 .8599 8621 11 .864 8665 8686 870 8729 8749 8770 8790 .8810 8830 12 8849 886 390 8925 894 8962 8980 8997 .9015 13 .9032 904 9066 9082 9099 9115 .9131 9147 9162 .9177 14 9192 920 9222 9256 9251 9265 .9279 9292 9306 9319 15 9332 9345 9357 9370 9382 9394 .9406 9418 9429 9441 16 9452 946 94/4 948 9495 9505 9515 9525 9535 954 17 9554 956 9573 9582 9591 9599 .9608 9616 9625 9633 9641 964 9656 9664 9671 9678 9686 9693 9699 9706 19 .9713 9719 9726 9752 9738 9/44 9750 9756 .9761 9767 2.0 977 9778 9783 78 9793 9798 ,9803 9808 9812 9817 .9821 9826 9830 9834 9838 984 9846 9850 .9854 .9857 .9861 986 9868 9871 9875 9878 9881 9884 9887 9890 .9893 9896 9898 9901 9904 2906 9909 9911 9913 .9916 2.4 .9918 .9920 9927 .9925 9927 9929 9931 .9932 9934 .9936 2.5 9938 9940 9941 9945 9946 9948 9949 9951 9952 2.6 .9953 995 9956 9957 9959 9960 .9961 .9962 .9963 9964 2.7 9965 9966 9967 996 9969 9970 9971 9972 9973 9974 2.8 .9974 9975 9976 9977 9977 9978 .9979 9979 9980 .9981 2.9 998 998 9982 998 9984 998 9985 9985 9986 9986 30 .9987 9987 9987 1866 9988 9989 9989 9989 9990 9990 3.1 9990 9991 9991 9991 9992 9992 9992 9992 9993 .9993 3.2 .9993 999 2994 399 9994 9994 9994 9995 .9995 9995 3.3 9995 566 9995 9996 9996 9996 9996 9996 9996 .9997 3.4 9997 999 9997 9997 9997 999 9997 9997 9997 9998 3.50 9999 and up NOTE: For values of z above 3,49, use 0.9999 for the area Common Critical Value "Use these common values that result from interpolation: Confidence | Critical z score Area Level Value 1.645 0.9500 0.90 1.645 2.575 0.9950 0.95 1.96 2.99 2.575Find the indicated 1Q score. The graph to the right depicts 1Q scores of adults, and those scores are normally distributed with a mean of 100 and a standard deviation of 15. Click to view page 1 of the table. Click to view page 2 of the table. The indicated 1Q score, x, is {Round to one decimal place as needed.) Standard Normal Table (Page 2) NOTE: For values of 7 above 3,49, use 0.9999 for the area. *Use thess common values that result from interpolation: 7score 1645 2578 v Standard Mormal () Distribution: Cumulative Area from the LEFT Area 09500 08850 01 02 03 05 06 07 08 09 Comman Critical Valu 08