

Answered step by step
Verified Expert Solution
Question
1 Approved Answer
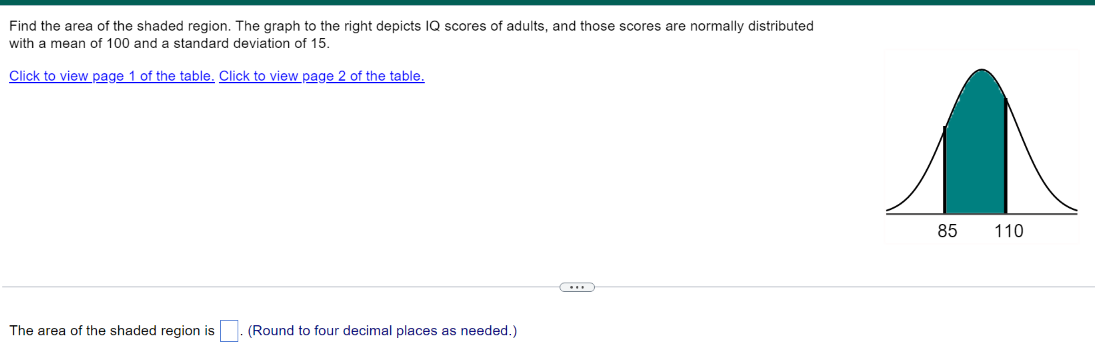
Find the area of the shaded region. The graph to the right depicts IQ scores of adults. and these scores- are normally distributed with a
Step by Step Solution
There are 3 Steps involved in it
Step: 1

Get Instant Access to Expert-Tailored Solutions
See step-by-step solutions with expert insights and AI powered tools for academic success
Step: 2

Step: 3
Ace Your Homework with AI
Get the answers you need in no time with our AI-driven, step-by-step assistance
Get Started
Elementary Differential Equations And Boundary Value Problems
Authors: William E Boyce, Richard C DiPrima
8th Edition
0470476389, 9780470476383