

Answered step by step
Verified Expert Solution
Question
1 Approved Answer
find the following year ( 2020, 2019, 2018, 2017, 2016 ) 1. Defensive Interval 2. Inventory to working capital ratio 3. Inventory turnover period J29
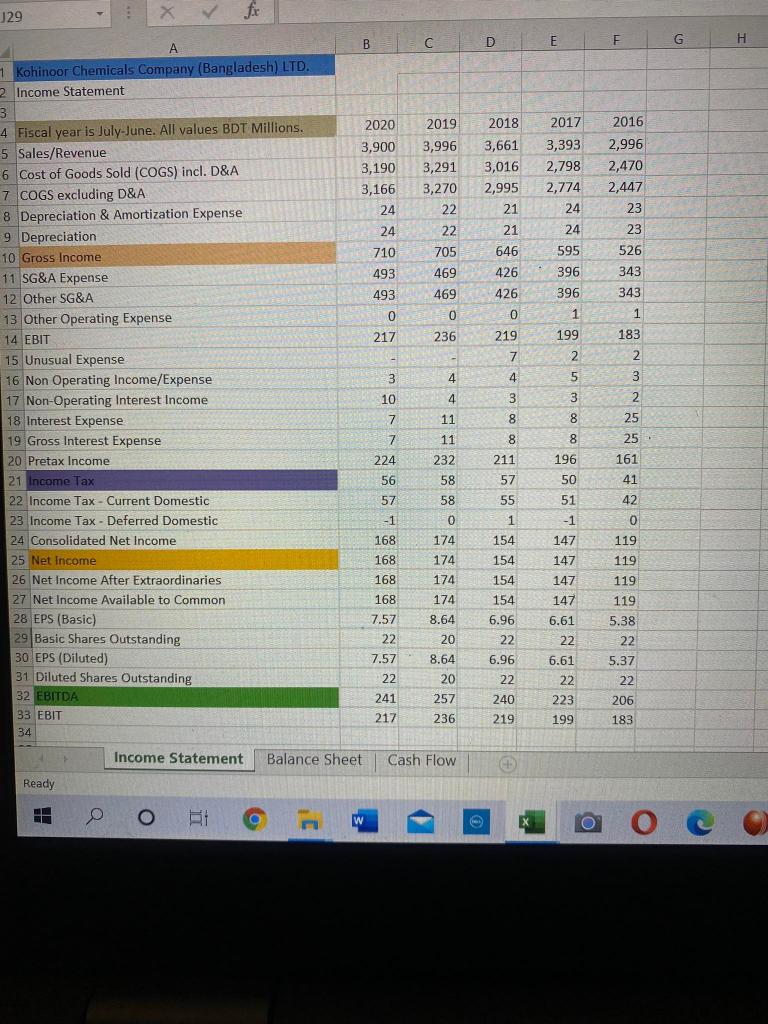
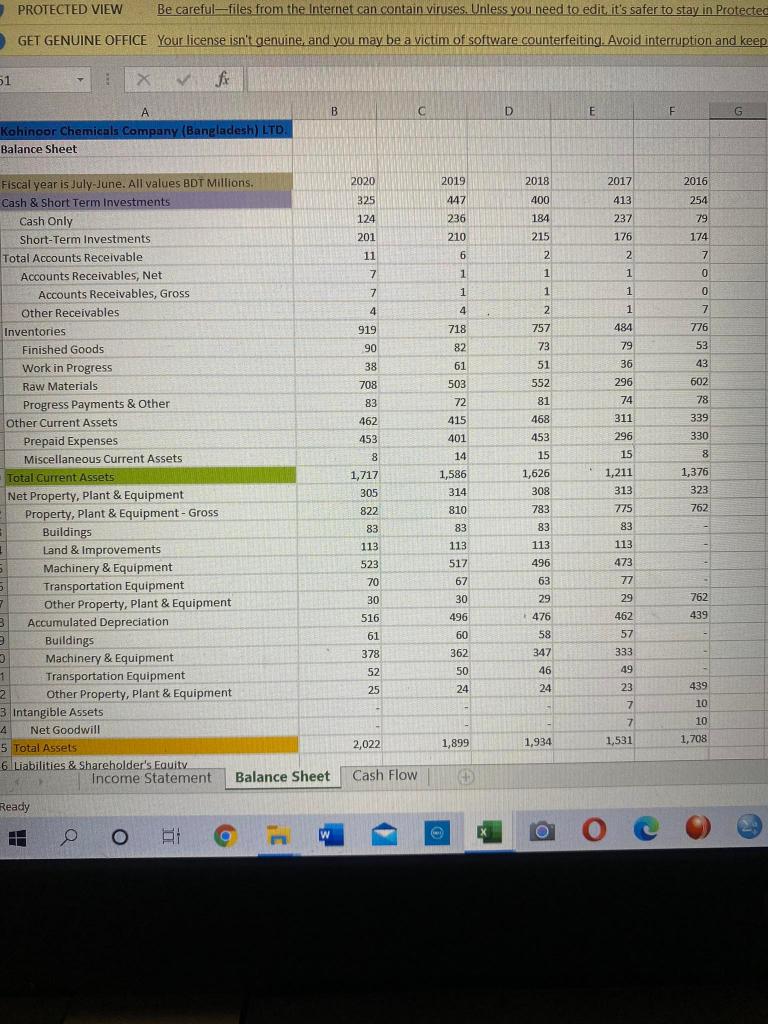
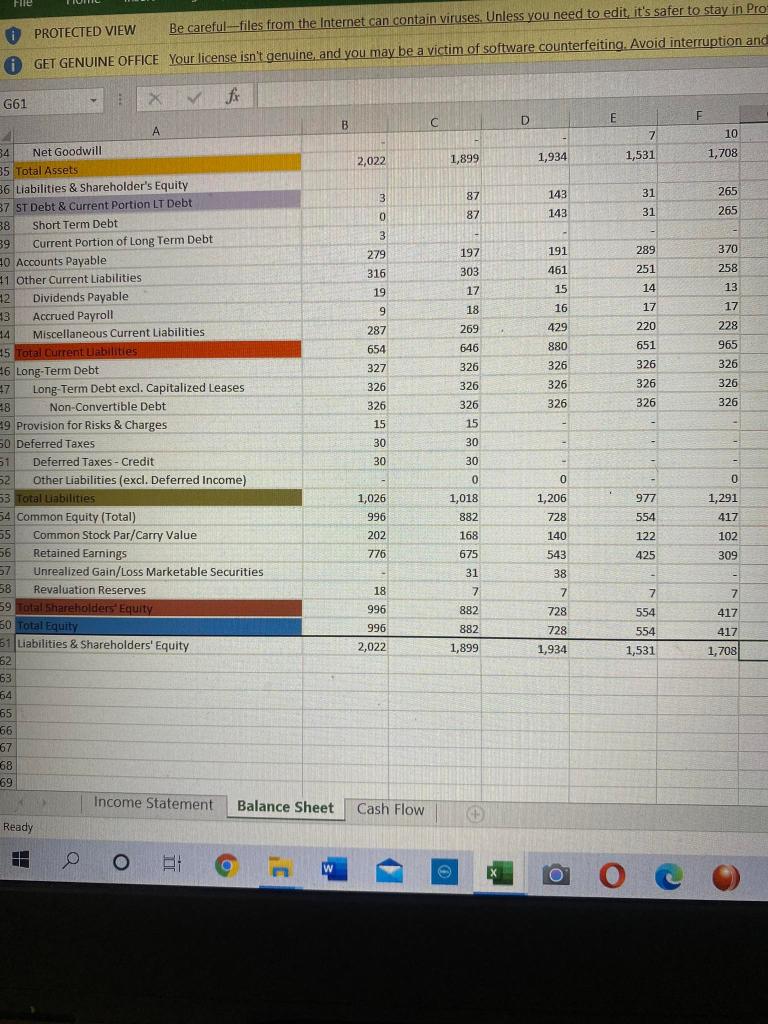
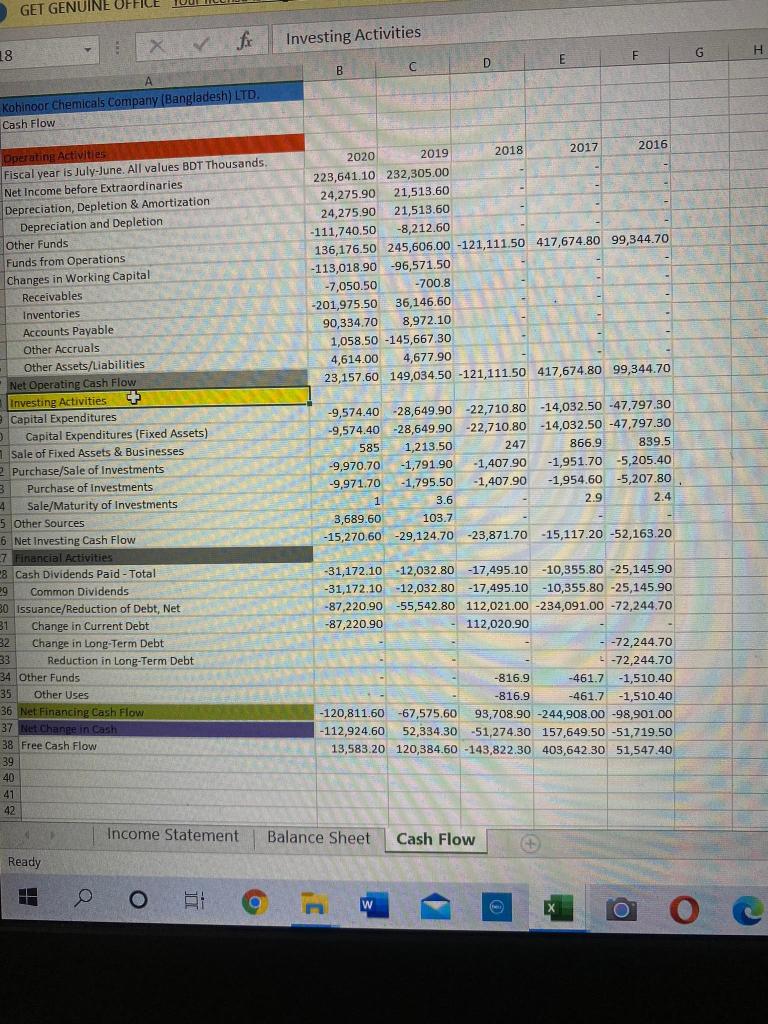
find the following year ( 2020, 2019, 2018, 2017, 2016 )
1. Defensive Interval
2. Inventory to working capital ratio
3. Inventory turnover period
J29 X fr B D E F G H 2018 2017 2016 2020 3,900 3,190 3,166 24 3,661 3,016 2,995 21 21 646 3,393 2,798 2,774 24 2,996 2,470 2,447 23 2019 3,996 3,291 3,270 22 22 705 469 469 0 24 24 1 Kohinoor Chemicals Company (Bangladesh) LTD. 2 Income Statement 3 4 Fiscal year is July-June. All values BDT Millions. 5 Sales/Revenue 6 Cost of Goods Sold (COGS) incl. D&A 7 COGS excluding D&A 8 Depreciation & Amortization Expense 9 Depreciation 10 Gross Income 11 SG&A Expense 12 Other SG&A 13 Other Operating Expense 14 EBIT 15 Unusual Expense 16 Non Operating Income/Expense 17 Non-Operating Interest Income 18 Interest Expense 19 Gross Interest Expense 20 Pretax Income 23 526 710 493 493 343 426 426 595 396 396 1 0 0 343 1 183 217 236 199 219 7 4 4. 2 - 2 5 5 3 3 4 4 10 3 3 2 25 7 7 11 8 11 25 7 224 8 8 196 161 8 8 211 57 55 1 50 41 42 232 58 58 0 174 174 174 56 57 -1 168 168 0 119 119 119 51 -1 147 147 147 147 6.61 22 168 21 Income Tax 22 Income Tax - Current Domestic 23 Income Tax - Deferred Domestic 24 Consolidated Net Income 25 Net Income 26 Net Income After Extraordinaries 27 Net Income Available to Common 28 EPS (Basic) 29 Basic Shares Outstanding 30 EPS (Diluted) 31 Diluted Shares Outstanding 32 EBITDA 33 EBIT 34 174 168 7.57 154 154 154 154 6.96 22 6.96 22 240 219 8.64 20 8.64 119 5.38 22 22 7.57 22 241 217 5.37 22 20 257 236 6.61 22 223 199 206 183 Income Statement Balance Sheet Cash Flow Ready ORA w - ] o PROTECTED VIEW Be careful-files from the Internet can contain viruses. Unless you need to edit. it's safer to stay in Protected GET GENUINE OFFICE Your license isn't genuine, and you may be a victim of software counterfeiting. Avoid interruption and keep 51 X fax B C D E E F G Kohinoor Chemicals Company (Bangladesh) LTD. Balance Sheet 2020 2018 2017 2016 325 2019 447 236 400 254 184 413 237 176 124 201 79 210 215 174 7 11 2 6 1 2 1 7 7 1 0 0 0 0 7 1 1 1 4 4 1 919 90 718 82 2 2 757 73 484 79 36 7 776 53 38 43 61 503 51 552 708 602 296 74 81 83 462 453 72 415 401 468 311 296 78 339 330 453 15 8 Fiscal year is July-June. All values BDT Millions. Cash & Short Term Investments Cash Only Short-Term Investments Total Accounts Receivable Accounts Receivables, Net Accounts Receivables, Gross Other Receivables Inventories Finished Goods Work in Progress Raw Materials Progress Payments & Other Other Current Assets Prepaid Expenses Miscellaneous Current Assets Total Current Assets Net Property, Plant & Equipment Property, Plant & Equipment - Gross Buildings 1 Land & Improvements Machinery & Equipment Transportation Equipment 7 Other Property, Plant & Equipment 3 Accumulated Depreciation Buildings 3 Machinery & Equipment 1 Transportation Equipment Other Property, Plant & Equipment 3 Intangible Assets 4 Net Goodwill 5 Total Assets 6. Liabilities & Shareholder's Equity Income Statement Balance Sheet 8 1,717 305 14 1,586 314 15 1,211 1,626 308 1,376 323 313 822 810 783 762 775 83 83 83 83 113 113 113 113 473 496 523 70 517 67 63 77 30 29 29 762 30 496 516 476 462 439 60 58 57 362 61 378 52 25 347 46 333 49 50 24 24 439 23 7 7 7 10 10 - 1,899 2,022 1,934 1,531 1,708 Cash Flow Ready O BA 2 o H W File 0 PROTECTED VIEW Be careful--files from the Internet can contain viruses. Unless you need to edit it's safer to stay in Pro O GET GENUINE OFFICE Your license isn't genuine, and you may be a victim of software counterfeiting. Avoid interruption and X G61 E F D B C 10 7 1,531 1,899 1.934 2,022 1,708 87 3 31 143 265 87 0 143 31 265 3 279 197 370 191 461 289 251 316 303 258 17 14 19 13 18 17 17 15 16 429 880 9 9 287 654 269 228 220 651 646 965 327 326 326 326 326 326 326 326 326 326 326 326 326 326 326 15 15 . - 30 30 30 30 - - A 34 Net Goodwill 35 Total Assets 36 Liabilities & Shareholder's Equity 37 ST Debt & Current Portion LT Debt 38 Short Term Debt 39 Current Portion of Long Term Debt 20 Accounts Payable 1 Other Current Liabilities 12 Dividends Payable 13 Accrued Payroll 14 Miscellaneous Current Liabilities 25 Total Current abilities 6 Long-Term Debt 47 Long-Term Debt excl. Capitalized Leases 8 Non-Convertible Debt 9 Provision for Risks & Charges 60 Deferred Taxes 1 Deferred Taxes - Credit 52 Other Liabilities (excl. Deferred Income) 53 Total Liabilities 54 Common Equity (Total) 55 Common Stock Par/Carry Value 56 Retained Earnings 57 Unrealized Gain/Loss Marketable Securities 58 Revaluation Reserves 59 Total Shareholders Equity 80 Total Equity 61 Liabilities & Shareholders' Equity 62 63 64 65 66 67 68 69 Income Statement Balance Sheet Ready 0 0 0 977 1,026 996 1,018 882 1,206 728 140 1,291 417 554 122 202 168 102 776 675 543 425 309 31 38 - 7 7 7 7 882 18 996 996 2,022 882 728 728 1,934 554 554 1,531 417 417 1,708 1,899 Cash Flow + O BE W o oc GET GENUINE OFFICE x & fic Investing Activities G F 18 H E D B C A Kohinoor Chemicals Company (Bangladesh) LTD. Cash Flow 2020 2019 2018 2017 2016 223,641.10 232,305.00 24,275.90 21,513.60 24,275.90 21,513.60 -111,740.50 -8,212.60 136,176.50 245,606.00 -121,111.50 417,674.80 99,344.70 -113,018.90 -96,571.50 -7,050.50 -700.8 -201,975.50 36,146.60 90,334.70 8,972.10 1,058.50 -145,667.30 4,614.00 4,677.90 23,157.60 149,034.50 -121,111.50 417,674.80 99,344.70 839.5 Operating Activities Fiscal year is July-lune. All values BDT Thousands Net Income before Extraordinaries Depreciation, Depletion & Amortization Depreciation and Depletion Other Funds Funds from Operations Changes in Working Capital Receivables Inventories Accounts Payable Other Accruals Other Assets/Liabilities Net Operating Cash Flow Investing Activities Capital Expenditures Capital Expenditures (Fixed Assets) 1 Sale of Fixed Assets & Businesses Purchase/Sale of Investments 3 Purchase of Investments 4 Sale/Maturity of investments 5 Other Sources 6 Net Investing Cash Flow 7 Financial Activities 8 Cash Dividends Paid - Total 8 29 Common Dividends 30 Issuance/Reduction of Debt, Net 31 Change in Current Debt 32 Change in Long-Term Debt 33 Reduction in Long-Term Debt 34 Other Funds 35 Other Uses 36 Net Financing Cash Flow 37 Net Change in Cash 38 Free Cash Flow 39 40 41 42 -9,574.40 -28,649.90 -22,710.80 -14,032.50 -47,797.30 -9,574.40 -28,649.90 -22,710.80-14,032.50 -47,797.30 585 1,213.50 247 866.9 -9,970.70 -1,791.90 -1,407.90 -1,951.70 -5,205.40 -9,971.70 -1,795.50 -1,407.90 -1,954.60 -5,207.80 1 3.6 2.9 2.4 3,689.60 103.7 -15,270.60 -29,124.70 -23,871.70 -15,117.20 -52,163.20 -31,172.10 -12,032.80-17,495.10 -10,355.80 -25,145.90 -31,172,10 -12,032.80 -17,495.10 -10,355.80 -25,145.90 -87,220.90 -55,542.80 112,021.00 -234,091.00 -72,244.70 -87,220.90 - 112,020.90 - -72,244.70 -72,244.70 -816.9 -461.7 -1,510.40 -816.9 -461.7 -1,510.40 -120,811.60-67,575,60 93,708.90 -244,908.00 -98,901.00 -112,924.60 52,334.30 52,334.30 -51,274.30 157,649.50 -51,719.50 13,583.20 120,384.60 -143,822.30 403,642.30 51,547.40 Income Statement Balance Sheet Cash Flow Ready 0 0 1 w wStep by Step Solution
There are 3 Steps involved in it
Step: 1

Get Instant Access to Expert-Tailored Solutions
See step-by-step solutions with expert insights and AI powered tools for academic success
Step: 2

Step: 3
Ace Your Homework with AI
Get the answers you need in no time with our AI-driven, step-by-step assistance
Get Started
Social Economic And Environmental Impacts Between Sustainable Financial Systems And Financial Markets
Authors: Magdalena Ziolo
1st Edition
179981033X,1799810364