

Answered step by step
Verified Expert Solution
Question
1 Approved Answer
Find the indicated z score. The graph depicts the standard normal distribution with mean 0 and standard deviation 1. Click to view page 1
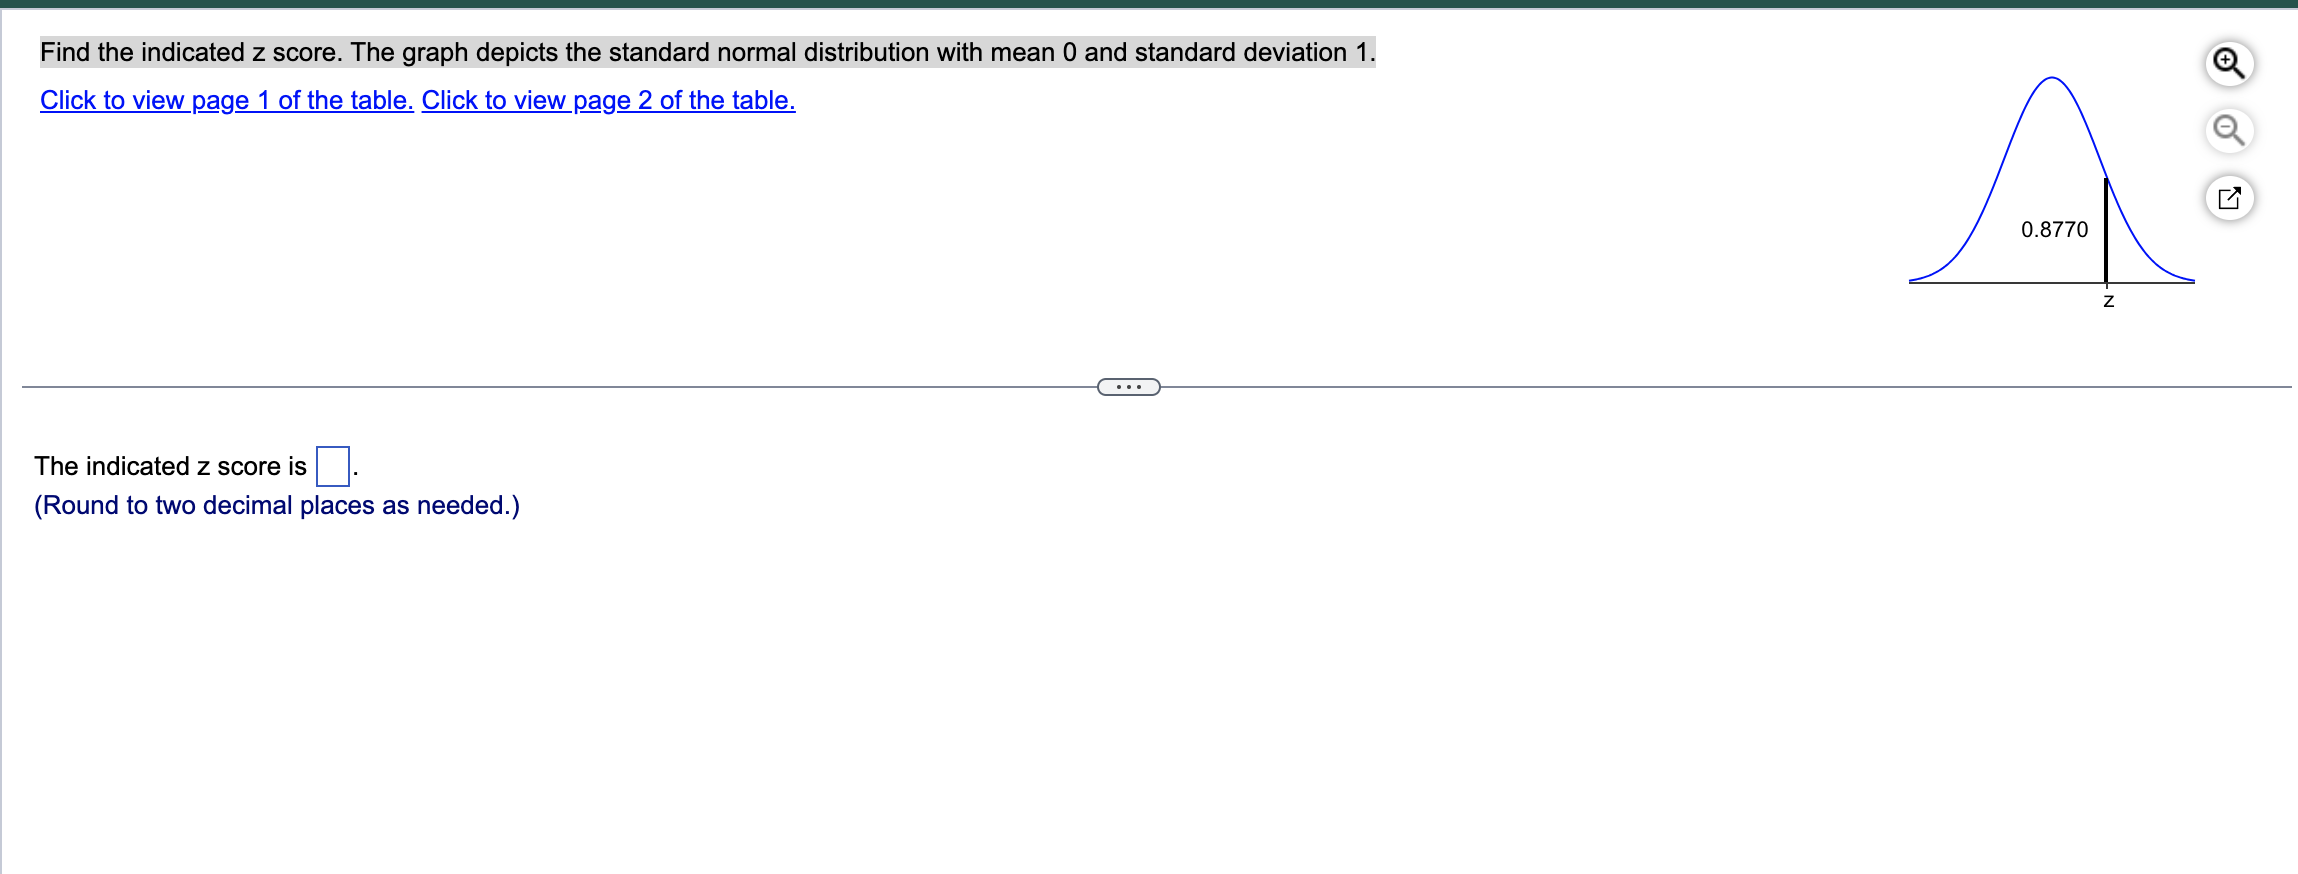
Find the indicated z score. The graph depicts the standard normal distribution with mean 0 and standard deviation 1. Click to view page 1 of the table. Click to view page 2 of the table. A 0.8770 Z The indicated z score is (Round to two decimal places as needed.) ...
Step by Step Solution
There are 3 Steps involved in it
Step: 1

Get Instant Access to Expert-Tailored Solutions
See step-by-step solutions with expert insights and AI powered tools for academic success
Step: 2

Step: 3
Ace Your Homework with AI
Get the answers you need in no time with our AI-driven, step-by-step assistance
Get Started
Cambridge IGCSE And O Level Additional Mathematics
Authors: Val Hanrahan, Jeanette Powell
1st Edition
1510421645, 978-1510421646