find the market value ratios 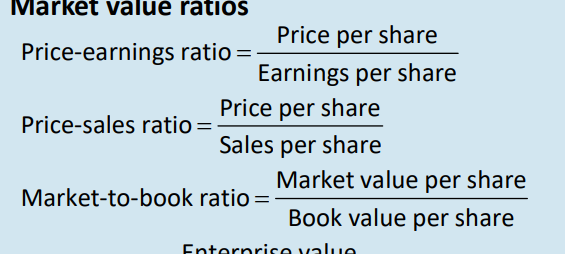
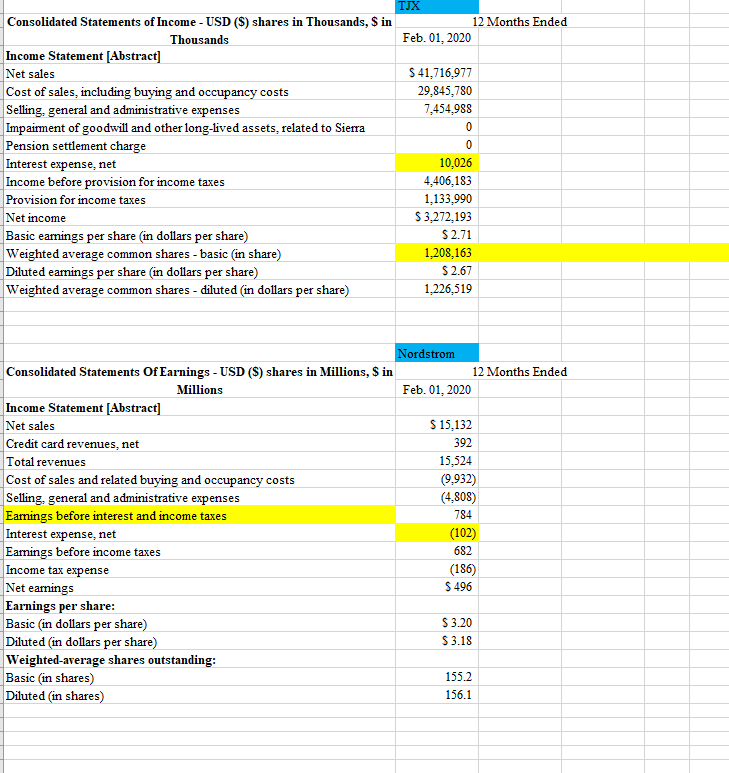
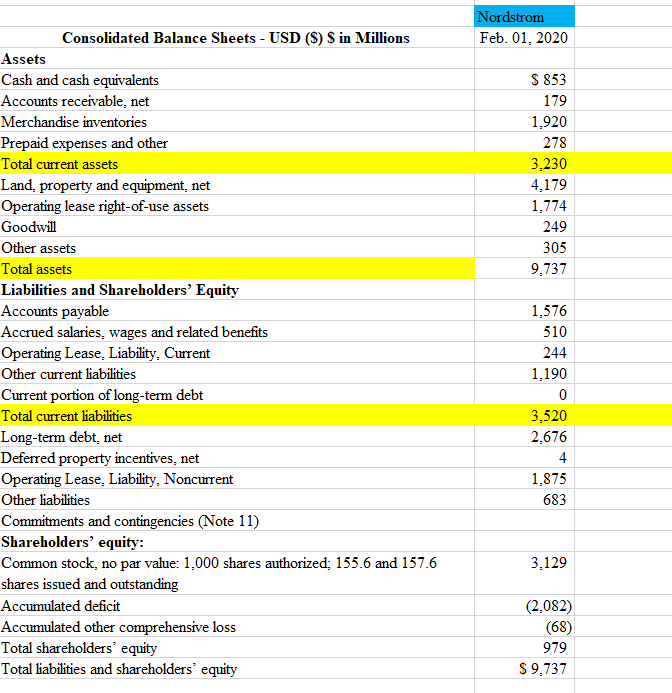
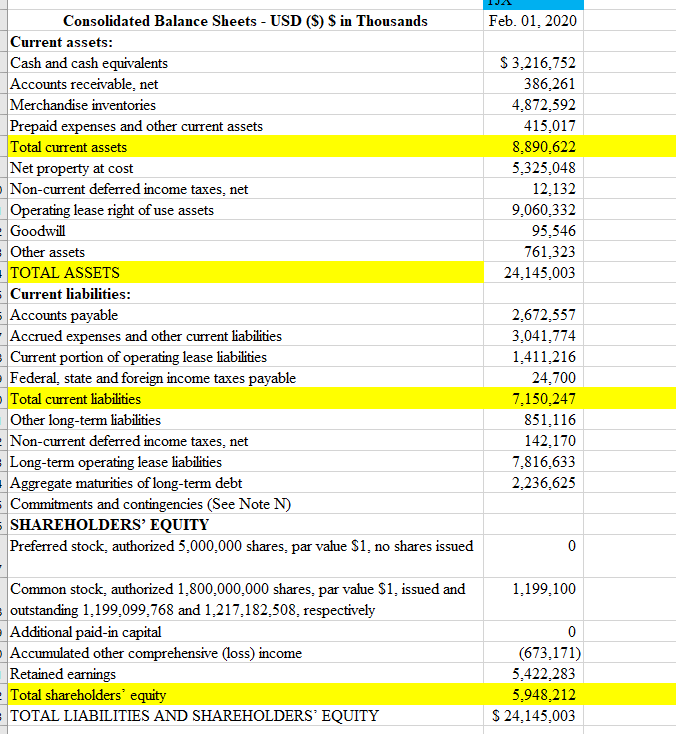
Market value ratios Price per share Price-earnings ratio Earnings per share Price per share Price-sales ratio= Sales per share Market value per share Market-to-book ratio = Book value per share ornr TJX Consolidated Statements of Income - USD ($) shares in Thousands, S in 12 Months Ended Thousands Feb. 01, 2020 Income Statement (Abstract] Net sales $ 41,716,977 Cost of sales, including buying and occupancy costs 29,845,780 Selling, general and administrative expenses 7,454,988 Impairment of goodwill and other long-lived assets, related to Sierra 0 Pension settlement charge 0 Interest expense, net 10,026 Income before provision for income taxes 4,406,183 Provision for income taxes 1,133,990 Net income $3,272,193 Basic eamings per share (in dollars per share) $2.71 Weighted average common shares - basic (in share) 1,208,163 Diluted earnings per share in dollars per share) $ 2.67 Weighted average common shares - diluted (in dollars per share) 1.226,519 Nordstrom Consolidated Statements Of Earnings - USD ($) shares in Millions, $ in 12 Months Ended Millions Feb. 01, 2020 Income Statement [Abstract] Net sales $ 15,132 Credit card revenues, net 392 Total revenues 15,524 Cost of sales and related buying and occupancy costs (9.932) Selling, general and administrative expenses (4,808) Earnings before interest and income taxes 784 Interest expense, net (102) Earnings before income taxes 682 Income tax expense (186) Net earnings $ 496 Earnings per share: Basic (in dollars per share) $ 3.20 Diluted (in dollars per share) $ 3.18 Weighted average shares outstanding: Basic (in shares) 155.2 Diluted in shares) 156.1 Nordstrom Feb. 01. 2020 $ 853 179 1,920 278 3,230 4,179 1,774 249 305 9.737 Consolidated Balance Sheets - USD ($) $ in Millions Assets Cash and cash equivalents Accounts receivable, net Merchandise inventories Prepaid expenses and other Total current assets Land, property and equipment, net Operating lease right-of-use assets Goodwill Other assets Total assets Liabilities and Shareholders' Equity Accounts payable Accrued salaries, wages and related benefits Operating Lease. Liability, Current Other current liabilities Current portion of long-term debt Total current liabilities Long-term debt, net Deferred property incentives, net Operating Lease. Liability, Noncurrent Other liabilities Commitments and contingencies (Note 11) Shareholders' equity: Common stock, no par value: 1,000 shares authorized; 155.6 and 157.6 shares issued and outstanding Accumulated deficit Accumulated other comprehensive loss Total shareholders' equity Total liabilities and shareholders' equity 1,576 510 244 1.190 0 3,520 2,676 4 1.875 683 3,129 (2.082) (68) 979 $ 9.737 Feb. 01, 2020 $ 3,216,752 386,261 4,872,592 415,017 8.890,622 5.325,048 12,132 9,060,332 95,546 761,323 24.145.003 Consolidated Balance Sheets - USD ($) $ in Thousands Current assets: Cash and cash equivalents Accounts receivable. net Merchandise inventories Prepaid expenses and other current assets Total current assets Net property at cost Non-current deferred income taxes, net Operating lease right of use assets - Goodwill = Other assets TOTAL ASSETS Current liabilities: = Accounts payable Accrued expenses and other current liabilities Current portion of operating lease liabilities Federal, state and foreign income taxes payable Total current liabilities Other long-term liabilities = Non-current deferred income taxes, net = Long-term operating lease liabilities Aggregate maturities of long-term debt Commitments and contingencies (See Note N) SHAREHOLDERS' EQUITY Preferred stock, authorized 5.000.000 shares. par value $1. no shares issued 2,672,557 3,041,774 1.411.216 24,700 7,150,247 851,116 142.170 7.816,633 2,236,625 0 1.199,100 Common stock, authorized 1.800.000.000 shares, par value $1, issued and outstanding 1.199,099,768 and 1,217,182,508, respectively Additional paid-in capital Accumulated other comprehensive (loss) income Retained earnings Total shareholders' equity TOTAL LIABILITIES AND SHAREHOLDERS' EQUITY 0 (673,171) 5.422,283 5.948,212 $ 24,145,003 Market value ratios Price per share Price-earnings ratio Earnings per share Price per share Price-sales ratio= Sales per share Market value per share Market-to-book ratio = Book value per share ornr TJX Consolidated Statements of Income - USD ($) shares in Thousands, S in 12 Months Ended Thousands Feb. 01, 2020 Income Statement (Abstract] Net sales $ 41,716,977 Cost of sales, including buying and occupancy costs 29,845,780 Selling, general and administrative expenses 7,454,988 Impairment of goodwill and other long-lived assets, related to Sierra 0 Pension settlement charge 0 Interest expense, net 10,026 Income before provision for income taxes 4,406,183 Provision for income taxes 1,133,990 Net income $3,272,193 Basic eamings per share (in dollars per share) $2.71 Weighted average common shares - basic (in share) 1,208,163 Diluted earnings per share in dollars per share) $ 2.67 Weighted average common shares - diluted (in dollars per share) 1.226,519 Nordstrom Consolidated Statements Of Earnings - USD ($) shares in Millions, $ in 12 Months Ended Millions Feb. 01, 2020 Income Statement [Abstract] Net sales $ 15,132 Credit card revenues, net 392 Total revenues 15,524 Cost of sales and related buying and occupancy costs (9.932) Selling, general and administrative expenses (4,808) Earnings before interest and income taxes 784 Interest expense, net (102) Earnings before income taxes 682 Income tax expense (186) Net earnings $ 496 Earnings per share: Basic (in dollars per share) $ 3.20 Diluted (in dollars per share) $ 3.18 Weighted average shares outstanding: Basic (in shares) 155.2 Diluted in shares) 156.1 Nordstrom Feb. 01. 2020 $ 853 179 1,920 278 3,230 4,179 1,774 249 305 9.737 Consolidated Balance Sheets - USD ($) $ in Millions Assets Cash and cash equivalents Accounts receivable, net Merchandise inventories Prepaid expenses and other Total current assets Land, property and equipment, net Operating lease right-of-use assets Goodwill Other assets Total assets Liabilities and Shareholders' Equity Accounts payable Accrued salaries, wages and related benefits Operating Lease. Liability, Current Other current liabilities Current portion of long-term debt Total current liabilities Long-term debt, net Deferred property incentives, net Operating Lease. Liability, Noncurrent Other liabilities Commitments and contingencies (Note 11) Shareholders' equity: Common stock, no par value: 1,000 shares authorized; 155.6 and 157.6 shares issued and outstanding Accumulated deficit Accumulated other comprehensive loss Total shareholders' equity Total liabilities and shareholders' equity 1,576 510 244 1.190 0 3,520 2,676 4 1.875 683 3,129 (2.082) (68) 979 $ 9.737 Feb. 01, 2020 $ 3,216,752 386,261 4,872,592 415,017 8.890,622 5.325,048 12,132 9,060,332 95,546 761,323 24.145.003 Consolidated Balance Sheets - USD ($) $ in Thousands Current assets: Cash and cash equivalents Accounts receivable. net Merchandise inventories Prepaid expenses and other current assets Total current assets Net property at cost Non-current deferred income taxes, net Operating lease right of use assets - Goodwill = Other assets TOTAL ASSETS Current liabilities: = Accounts payable Accrued expenses and other current liabilities Current portion of operating lease liabilities Federal, state and foreign income taxes payable Total current liabilities Other long-term liabilities = Non-current deferred income taxes, net = Long-term operating lease liabilities Aggregate maturities of long-term debt Commitments and contingencies (See Note N) SHAREHOLDERS' EQUITY Preferred stock, authorized 5.000.000 shares. par value $1. no shares issued 2,672,557 3,041,774 1.411.216 24,700 7,150,247 851,116 142.170 7.816,633 2,236,625 0 1.199,100 Common stock, authorized 1.800.000.000 shares, par value $1, issued and outstanding 1.199,099,768 and 1,217,182,508, respectively Additional paid-in capital Accumulated other comprehensive (loss) income Retained earnings Total shareholders' equity TOTAL LIABILITIES AND SHAREHOLDERS' EQUITY 0 (673,171) 5.422,283 5.948,212 $ 24,145,003