Answered step by step
Verified Expert Solution
Question
1 Approved Answer
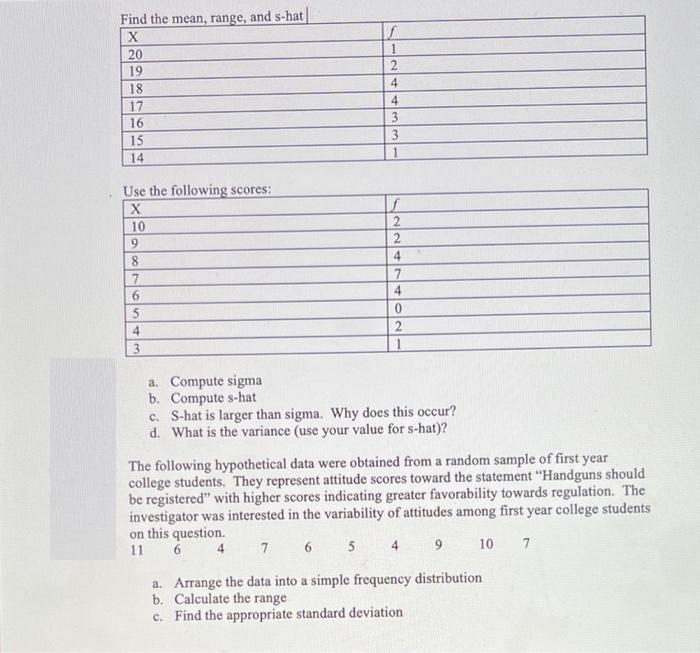
Find the mean, range, and s-hat X 20 19 18 17 16 15 14 Use the following scores: X 10 9 8 7 6

Find the mean, range, and s-hat X 20 19 18 17 16 15 14 Use the following scores: X 10 9 8 7 6 5 4 3 f 2 4 4 3 3 1 S 2 2 4 7 4 0 2 1 a. Compute sigma b. Compute s-hat c. S-hat is larger than sigma. Why does this occur? d. What is the variance (use your value for s-hat)? The following hypothetical data were obtained from a random sample of first year college students. They represent attitude scores toward the statement "Handguns should be registered" with higher scores indicating greater favorability towards regulation. The investigator was interested in the variability of attitudes among first year college students on this question. 11 6 7 6 5 4 9 10 a. Arrange the data into a simple frequency distribution b. Calculate the range c. Find the appropriate standard deviation 7
Step by Step Solution
★★★★★
3.44 Rating (160 Votes )
There are 3 Steps involved in it
Step: 1
ANSWER SOLUTION ONE a Mean 201918417443161531411 15909 b Range 433 40 c shat To calculate ...
Get Instant Access to Expert-Tailored Solutions
See step-by-step solutions with expert insights and AI powered tools for academic success
Step: 2

Step: 3

Ace Your Homework with AI
Get the answers you need in no time with our AI-driven, step-by-step assistance
Get Started


