

Answered step by step
Verified Expert Solution
Question
1 Approved Answer
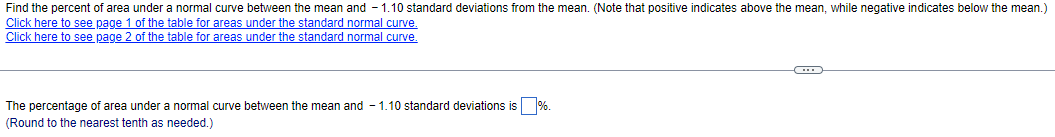
Find the percent of area under a normal curve between the mean and - 1.10 standard deviations from the mean. (Mote that positive indicates above

Step by Step Solution
There are 3 Steps involved in it
Step: 1

Get Instant Access to Expert-Tailored Solutions
See step-by-step solutions with expert insights and AI powered tools for academic success
Step: 2

Step: 3
Ace Your Homework with AI
Get the answers you need in no time with our AI-driven, step-by-step assistance
Get Started