Answered step by step
Verified Expert Solution
Question
1 Approved Answer
Find the relative frequency for the class with lower class tmit 35 Relative Frequency- 024 X% Give your answer as a percent, rounded to

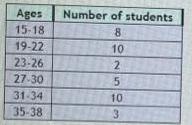
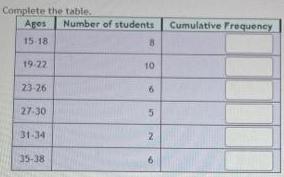
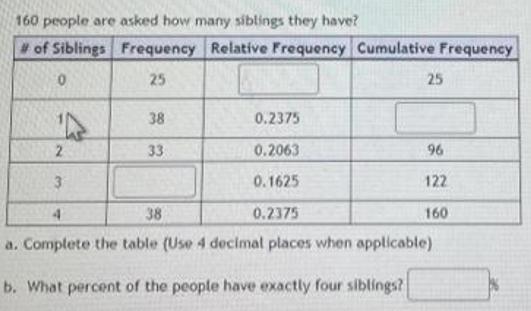
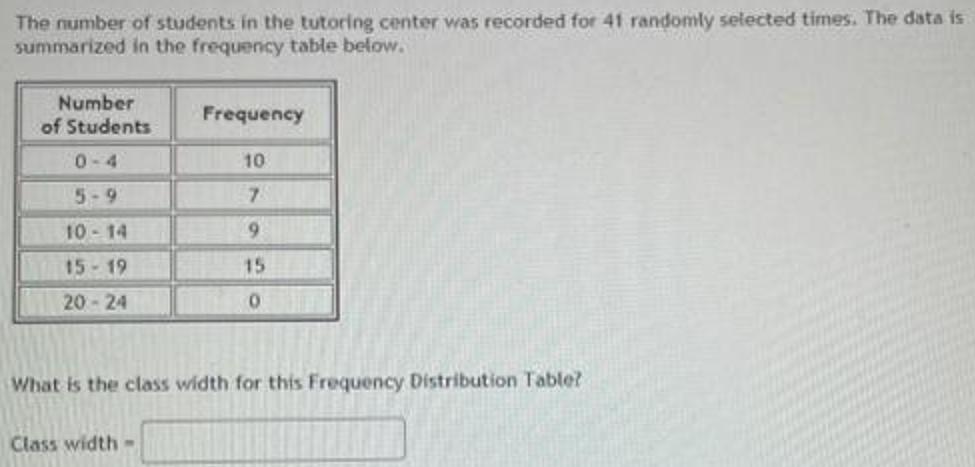

Find the relative frequency for the class with lower class tmit 35 Relative Frequency- 024 X% Give your answer as a percent, rounded to two decimal places Ages Number of students 15-18 8 19-22 10 23-26 2 27-30 31-34 35-38 5 10 3 Complete the table. Agos Number of students 15-18 19-22 23-26 27-30 31-34 35-38 8 10 5 2 Cumulative Frequency 160 people are asked how many siblings they have? # of Siblings Frequency Relative Frequency Cumulative Frequency 25 0 38 33 0.2375 0.2063 3 0.1625 4 38 0.2375 a. Complete the table (Use 4 decimal places when applicable) b. What percent of the people have exactly four siblings? 2 25 96 122 160 The number of students in the tutoring center was recorded for 41 randomly selected times. The data is summarized in the frequency table below. Number of Students 0-4 5-9 10-14 15-19 20-24 Frequency Class width- 10 7 9 15 0 What is the class width for this Frequency Distribution Table? If you want to create a frequecy distribution table using the data below and want a class width of 5, how many intervals will you have? (Hint: Start the first interval at 25.) 26 27 29 30 31 32 34 36 38 40 44 45 48 49 50 54 54 56 57 58 59 60 62 64 64
Step by Step Solution
★★★★★
3.51 Rating (158 Votes )
There are 3 Steps involved in it
Step: 1

Get Instant Access to Expert-Tailored Solutions
See step-by-step solutions with expert insights and AI powered tools for academic success
Step: 2

Step: 3

Ace Your Homework with AI
Get the answers you need in no time with our AI-driven, step-by-step assistance
Get Started


