Find the value of Boston Beer Company based on its projected future cash flows. Explain the process you used to arrive at the number.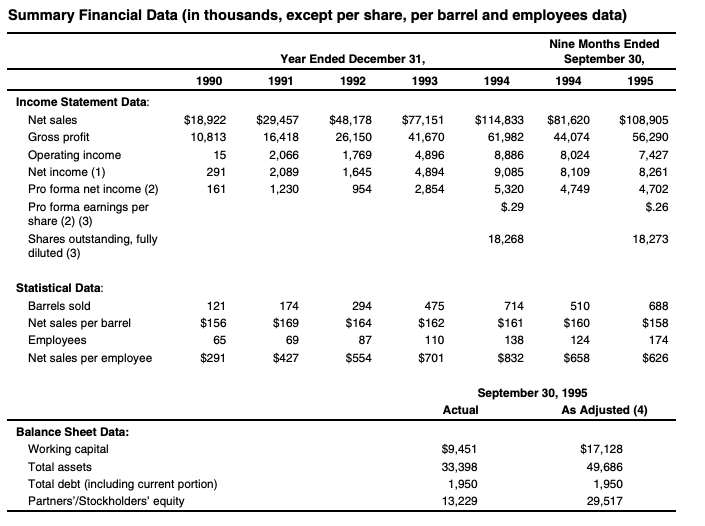
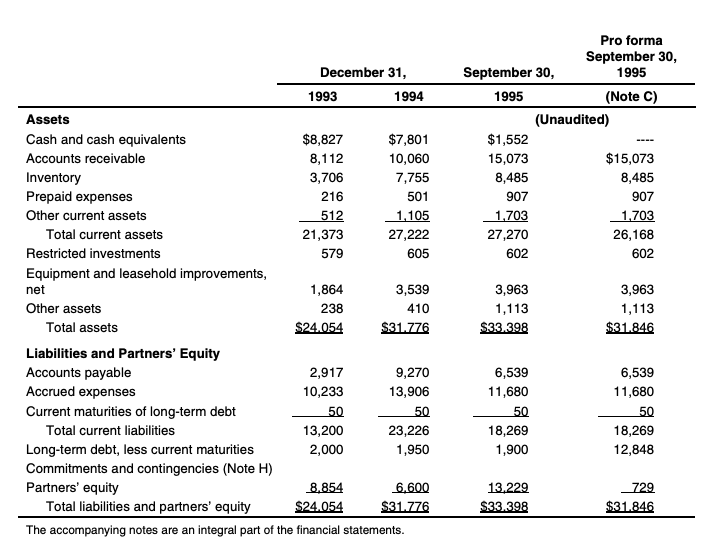
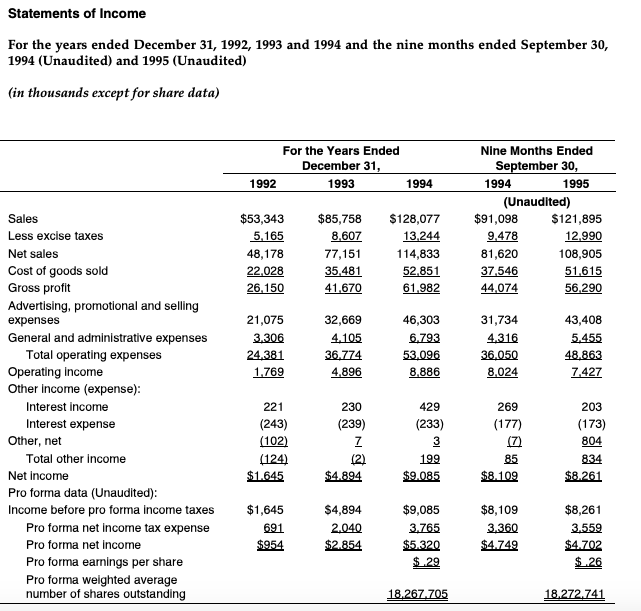
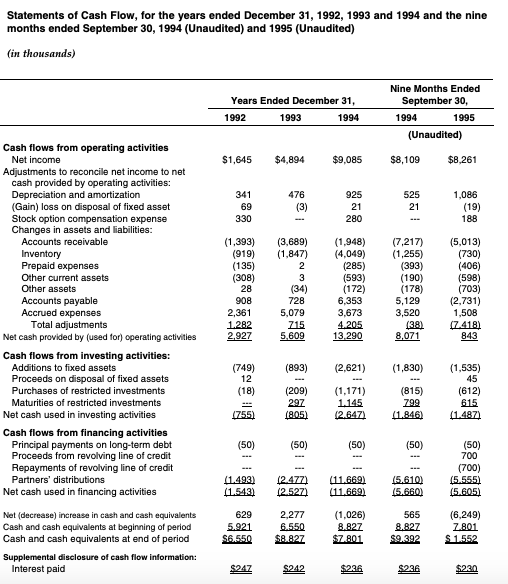
1993 Summary Financial Data (in thousands, except per share, per barrel and employees data) Nine Months Ended Year Ended December 31, September 30, 1990 1991 1992 1994 1994 1995 Income Statement Data: Net sales $18,922 $29,457 $48,178 $77,151 $114,833 $81,620 $108,905 Gross profit 10,813 16,418 26,150 41,670 61,982 44,074 56,290 Operating income 15 2,066 1,769 4,896 8,886 8,024 7,427 Net income (1) 291 2,089 1,645 4,894 9,085 8,109 8,261 Pro forma net income (2) 161 1,230 954 2,854 5,320 4,749 4,702 Pro forma earnings per $.29 $.26 share (2) (3) Shares outstanding, fully 18,268 18,273 diluted (3) Statistical Data: Barrels sold Net sales per barrel Employees Net sales per employee 121 $156 65 $291 174 $169 69 294 $164 87 $554 714 $161 475 $162 110 $701 138 $832 510 $160 124 $658 688 $158 174 $626 $427 September 30, 1995 Actual As Adjusted (4) Balance Sheet Data: Working capital Total assets Total debt (including current portion) Partners'/Stockholders' equity $9,451 33,398 1,950 13,229 $17,128 49,686 1,950 29,517 Pro forma September 30, September 30, 1995 1995 (Note C) (Unaudited) $1,552 15,073 $15,073 8,485 8,485 907 907 1,703 1.703 27,270 26,168 602 602 net December 31, 1993 1994 Assets Cash and cash equivalents $8,827 $7,801 Accounts receivable 8,112 10,060 Inventory 3,706 7,755 Prepaid expenses 216 501 Other current assets 512 1,105 Total current assets 21,373 27,222 Restricted investments 579 605 Equipment and leasehold improvements, 1,864 3,539 Other assets 238 410 Total assets $24.054 $31.776 Liabilities and Partners' Equity Accounts payable 2,917 9,270 Accrued expenses 10,233 13,906 Current maturities of long-term debt 50 50 Total current liabilities 13,200 23,226 Long-term debt, less current maturities 2,000 1,950 Commitments and contingencies (Note H) Partners' equity 8.854 6,600 Total liabilities and partners' equity $24.054 $31.776 The accompanying notes are an integral part of the financial statements. 3,963 1,113 $3.3.398 3,963 1,113 $31.846 6,539 11,680 50 18,269 1,900 6,539 11,680 50 18,269 12,848 13.229 $33.398 _729 $31.846 Statements of Income For the years ended December 31, 1992, 1993 and 1994 and the nine months ended September 30, 1994 (Unaudited) and 1995 (Unaudited) (in thousands except for share data) For the Years Ended December 31, 1992 1993 1994 $53,343 5,165 48,178 22.028 26,150 $85,758 8,607 77,151 35,481 41.670 $128,077 13.244 114,833 52.851 61,982 Nine Months Ended September 30, 1994 1995 (Unaudited) $91,098 $121,895 9.478 12.990 81,620 108,905 37,546 51,615 44,074 56,290 21,075 3.306 24.381 1.769 32,669 4.105 36.774 4,896 46,303 6.793 53.096 8,886 31,734 4.316 36,050 8,024 43,408 5.455 48.863 7.427 Sales Less excise taxes Net sales Cost of goods sold Gross profit Advertising, promotional and selling expenses General and administrative expenses Total operating expenses Operating income Other Income (expense): Interest income Interest expense Other, net Total other income Net income Pro forma data (Unaudited): Income before pro forma income taxes Pro forma net income tax expense Pro forma net income Pro forma earnings per share Pro forma weighted average number of shares outstanding 203 221 (243) (102) (124) $1.645 230 (239) 7 (2) $4.894 429 (233) 3 199 $9.085 269 (177) (7) 85 $8.109 (173) 804 834 $8.261 $1,645 691 $954 $4,894 2.040 $2.854 $9,085 3.765 $5,320 $.29 $8,109 3.360 $4.749 $8,261 3.559 $4.702 $.26 18.267.705 18.272.741 Statements of Cash Flow, for the years ended December 31, 1992, 1993 and 1994 and the nine months ended September 30, 1994 (Unaudited) and 1995 (Unaudited) (in thousands) Years Ended December 31, 1992 1993 1994 Nine Months Ended September 30, 1994 1995 (Unaudited) $1,645 $4,894 $9,085 $8,109 $8,261 341 69 330 476 (3) 925 21 280 525 21 1,086 (19) 188 (1,393) (919) (135) (308) 28 908 2,361 1.282 2.927 (3,689) (1,847) 2 3 (34) 728 5,079 715 5,609 (1,948) (4,049) (285) (593) (172) 6,353 3,673 4.205 13,290 (7,217) (1,255) (393) (190) (178) 5,129 3,520 (38) 8,071 (5,013) (730) (406) (598) (703) (2,731) 1,500 17.418) 843 Cash flows from operating activities Net income Adjustments to reconcile net income to net cash provided by operating activities: Depreciation and amortization (Gain) loss on disposal of fixed asset Stock option compensation expense Changes in assets and liabilities: Accounts receivable Inventory Prepaid expenses Other current assets Other assots Accounts payable Accrued expenses Total adjustments Net cash provided by (used for) operating activities Cash flows from investing activities: Additions to fixed assets Proceeds on disposal of fixed assets Purchases of restricted investments Maturities of restricted investments Net cash used in investing activities Cash flows from financing activities Principal payments on long-term debt Proceeds from revolving line of credit Repayments of revolving line of credit Partners' distributions Net cash used in financing activities Net (decrease) increase in cash and cash equivalents Cash and cash equivalents at beginning of period Cash and cash equivalents at end of period Supplemental disclosure of cash flow information: Interest paid (893) (2.621) (1.830) (749) 12 (18) (209) 297 (805) (1.171) 1.145 (2.647) (815) 799 (1.846) (1,535) 45 (612) 615 (1.487 (755) (50) (50) (50) (50) (50) 700 (700) (5.555) (5.605) (1.493) (1.542) 12.477) 12.527) (11.669) (11.669) (5.610) (5.660) 629 5.921 S6.550 2,277 6.550 $8.827 (1,026) 8.827 $7.801 565 8.827 $9.392 (6.249) 7.801 S 1.552 $247 5242 $286 $236 $220 1993 Summary Financial Data (in thousands, except per share, per barrel and employees data) Nine Months Ended Year Ended December 31, September 30, 1990 1991 1992 1994 1994 1995 Income Statement Data: Net sales $18,922 $29,457 $48,178 $77,151 $114,833 $81,620 $108,905 Gross profit 10,813 16,418 26,150 41,670 61,982 44,074 56,290 Operating income 15 2,066 1,769 4,896 8,886 8,024 7,427 Net income (1) 291 2,089 1,645 4,894 9,085 8,109 8,261 Pro forma net income (2) 161 1,230 954 2,854 5,320 4,749 4,702 Pro forma earnings per $.29 $.26 share (2) (3) Shares outstanding, fully 18,268 18,273 diluted (3) Statistical Data: Barrels sold Net sales per barrel Employees Net sales per employee 121 $156 65 $291 174 $169 69 294 $164 87 $554 714 $161 475 $162 110 $701 138 $832 510 $160 124 $658 688 $158 174 $626 $427 September 30, 1995 Actual As Adjusted (4) Balance Sheet Data: Working capital Total assets Total debt (including current portion) Partners'/Stockholders' equity $9,451 33,398 1,950 13,229 $17,128 49,686 1,950 29,517 Pro forma September 30, September 30, 1995 1995 (Note C) (Unaudited) $1,552 15,073 $15,073 8,485 8,485 907 907 1,703 1.703 27,270 26,168 602 602 net December 31, 1993 1994 Assets Cash and cash equivalents $8,827 $7,801 Accounts receivable 8,112 10,060 Inventory 3,706 7,755 Prepaid expenses 216 501 Other current assets 512 1,105 Total current assets 21,373 27,222 Restricted investments 579 605 Equipment and leasehold improvements, 1,864 3,539 Other assets 238 410 Total assets $24.054 $31.776 Liabilities and Partners' Equity Accounts payable 2,917 9,270 Accrued expenses 10,233 13,906 Current maturities of long-term debt 50 50 Total current liabilities 13,200 23,226 Long-term debt, less current maturities 2,000 1,950 Commitments and contingencies (Note H) Partners' equity 8.854 6,600 Total liabilities and partners' equity $24.054 $31.776 The accompanying notes are an integral part of the financial statements. 3,963 1,113 $3.3.398 3,963 1,113 $31.846 6,539 11,680 50 18,269 1,900 6,539 11,680 50 18,269 12,848 13.229 $33.398 _729 $31.846 Statements of Income For the years ended December 31, 1992, 1993 and 1994 and the nine months ended September 30, 1994 (Unaudited) and 1995 (Unaudited) (in thousands except for share data) For the Years Ended December 31, 1992 1993 1994 $53,343 5,165 48,178 22.028 26,150 $85,758 8,607 77,151 35,481 41.670 $128,077 13.244 114,833 52.851 61,982 Nine Months Ended September 30, 1994 1995 (Unaudited) $91,098 $121,895 9.478 12.990 81,620 108,905 37,546 51,615 44,074 56,290 21,075 3.306 24.381 1.769 32,669 4.105 36.774 4,896 46,303 6.793 53.096 8,886 31,734 4.316 36,050 8,024 43,408 5.455 48.863 7.427 Sales Less excise taxes Net sales Cost of goods sold Gross profit Advertising, promotional and selling expenses General and administrative expenses Total operating expenses Operating income Other Income (expense): Interest income Interest expense Other, net Total other income Net income Pro forma data (Unaudited): Income before pro forma income taxes Pro forma net income tax expense Pro forma net income Pro forma earnings per share Pro forma weighted average number of shares outstanding 203 221 (243) (102) (124) $1.645 230 (239) 7 (2) $4.894 429 (233) 3 199 $9.085 269 (177) (7) 85 $8.109 (173) 804 834 $8.261 $1,645 691 $954 $4,894 2.040 $2.854 $9,085 3.765 $5,320 $.29 $8,109 3.360 $4.749 $8,261 3.559 $4.702 $.26 18.267.705 18.272.741 Statements of Cash Flow, for the years ended December 31, 1992, 1993 and 1994 and the nine months ended September 30, 1994 (Unaudited) and 1995 (Unaudited) (in thousands) Years Ended December 31, 1992 1993 1994 Nine Months Ended September 30, 1994 1995 (Unaudited) $1,645 $4,894 $9,085 $8,109 $8,261 341 69 330 476 (3) 925 21 280 525 21 1,086 (19) 188 (1,393) (919) (135) (308) 28 908 2,361 1.282 2.927 (3,689) (1,847) 2 3 (34) 728 5,079 715 5,609 (1,948) (4,049) (285) (593) (172) 6,353 3,673 4.205 13,290 (7,217) (1,255) (393) (190) (178) 5,129 3,520 (38) 8,071 (5,013) (730) (406) (598) (703) (2,731) 1,500 17.418) 843 Cash flows from operating activities Net income Adjustments to reconcile net income to net cash provided by operating activities: Depreciation and amortization (Gain) loss on disposal of fixed asset Stock option compensation expense Changes in assets and liabilities: Accounts receivable Inventory Prepaid expenses Other current assets Other assots Accounts payable Accrued expenses Total adjustments Net cash provided by (used for) operating activities Cash flows from investing activities: Additions to fixed assets Proceeds on disposal of fixed assets Purchases of restricted investments Maturities of restricted investments Net cash used in investing activities Cash flows from financing activities Principal payments on long-term debt Proceeds from revolving line of credit Repayments of revolving line of credit Partners' distributions Net cash used in financing activities Net (decrease) increase in cash and cash equivalents Cash and cash equivalents at beginning of period Cash and cash equivalents at end of period Supplemental disclosure of cash flow information: Interest paid (893) (2.621) (1.830) (749) 12 (18) (209) 297 (805) (1.171) 1.145 (2.647) (815) 799 (1.846) (1,535) 45 (612) 615 (1.487 (755) (50) (50) (50) (50) (50) 700 (700) (5.555) (5.605) (1.493) (1.542) 12.477) 12.527) (11.669) (11.669) (5.610) (5.660) 629 5.921 S6.550 2,277 6.550 $8.827 (1,026) 8.827 $7.801 565 8.827 $9.392 (6.249) 7.801 S 1.552 $247 5242 $286 $236 $220