Answered step by step
Verified Expert Solution
Question
1 Approved Answer
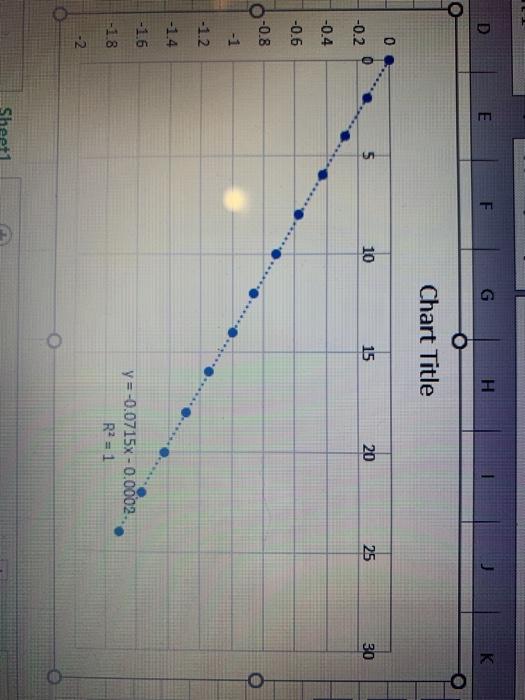
find the value of k (radioactive decay constant) based on this information. D E F G H K Chart Title 0 5 10 15 20
find the value of k (radioactive decay constant) based on this information. 

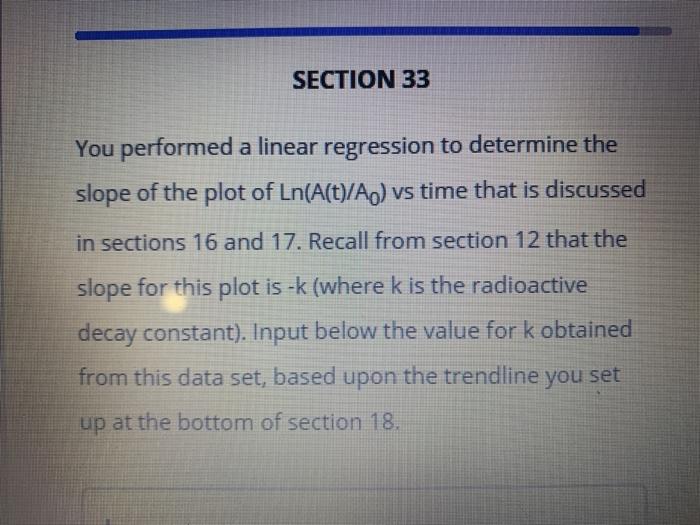
D E F G H K Chart Title 0 5 10 15 20 25 30 -0.2 -0.4 -0.6 0-0.8 -1 -1.2 -1.4 -1.6 -1.8 y=-0.0715x -0.0002 R? = 1 -2 Sheet1 SECTION 33 You performed a linear regression to determine the slope of the plot of Ln(A(t)/A) vs time that is discussed in sections 16 and 17. Recall from section 12 that the slope for this plot is -k (where k is the radioactive decay constant). Input below the value for k obtained from this data set, based upon the trendline you set up at the bottom of section 18 

Step by Step Solution
There are 3 Steps involved in it
Step: 1

Get Instant Access to Expert-Tailored Solutions
See step-by-step solutions with expert insights and AI powered tools for academic success
Step: 2

Step: 3

Ace Your Homework with AI
Get the answers you need in no time with our AI-driven, step-by-step assistance
Get Started


