Answered step by step
Verified Expert Solution
Question
1 Approved Answer
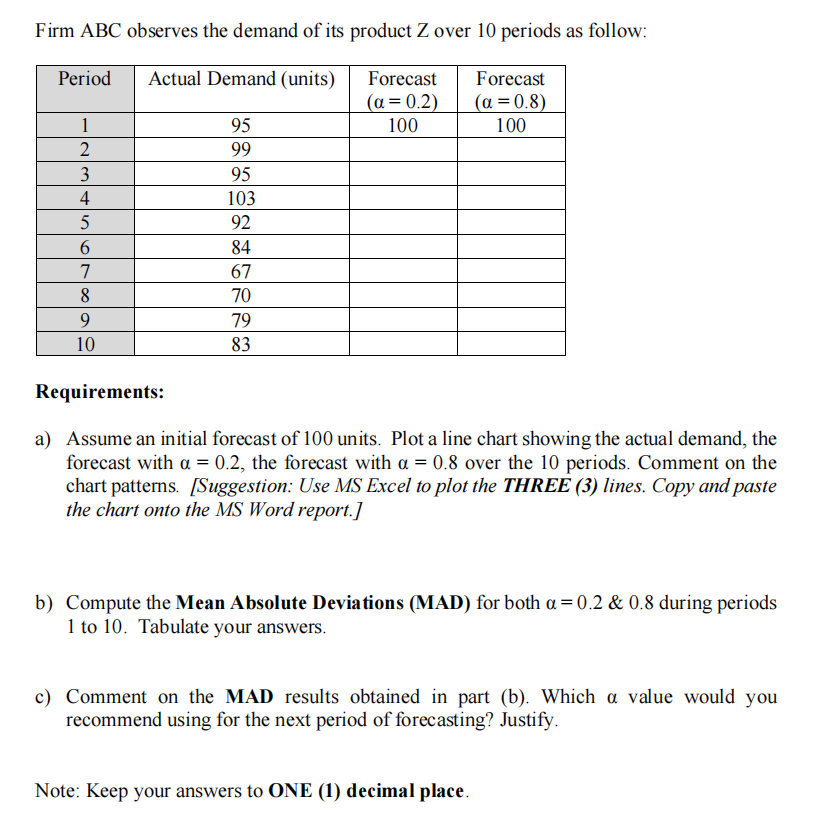
Firm ABC observes the demand of its product Z over 10 periods as follow: Requirements: a) Assume an initial forecast of 100 units. Plot a
 Firm ABC observes the demand of its product Z over 10 periods as follow: Requirements: a) Assume an initial forecast of 100 units. Plot a line chart showing the actual demand, the forecast with =0.2, the forecast with =0.8 over the 10 periods. Comment on the chart patterns. [Suggestion: Use MS Excel to plot the THREE (3) lines. Copy and paste the chart onto the MS Word report.] b) Compute the Mean Absolute Deviations (MAD) for both =0.2&0.8 during periods 1 to 10. Tabulate your answers. c) Comment on the MAD results obtained in part (b). Which value would you recommend using for the next period of forecasting? Justify. Note: Keep your answers to ONE (1) decimal place
 Step by Step Solution
There are 3 Steps involved in it
Step: 1

Get Instant Access to Expert-Tailored Solutions
See step-by-step solutions with expert insights and AI powered tools for academic success
Step: 2

Step: 3

Ace Your Homework with AI
Get the answers you need in no time with our AI-driven, step-by-step assistance
Get Started


