Answered step by step
Verified Expert Solution
Link Copied!

Question

1 Approved Answer

Firm ABC observes the demand of its product Z over 10 periods as follow: Requirements: a) Assume an initial forecast of 100 units. Plot a
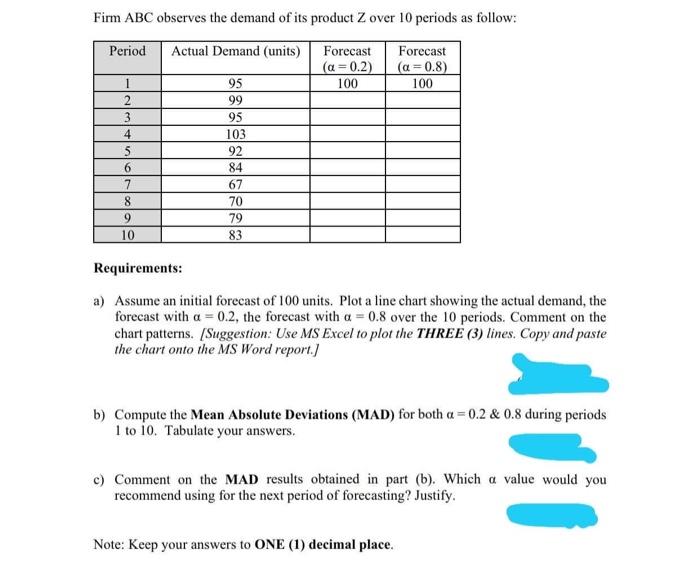
image text in transcribed
Firm ABC observes the demand of its product Z over 10 periods as follow: Requirements: a) Assume an initial forecast of 100 units. Plot a line chart showing the actual demand, the forecast with =0.2, the forecast with =0.8 over the 10 periods. Comment on the chart patterns. [Suggestion: Use MS Excel to plot the THREE (3) lines. Copy and paste the chart onto the MS Word report.] b) Compute the Mean Absolute Deviations (MAD) for both =0.2&0.8 during periods 1 to 10. Tabulate your answers. c) Comment on the MAD results obtained in part (b). Which value would you recommend using for the next period of forecasting? Justify

Step by Step Solution

There are 3 Steps involved in it

Step: 1

blur-text-image

Get Instant Access to Expert-Tailored Solutions

See step-by-step solutions with expert insights and AI powered tools for academic success

Step: 2

blur-text-image

Step: 3

blur-text-image

Ace Your Homework with AI

Get the answers you need in no time with our AI-driven, step-by-step assistance

Get Started

Recommended Textbook for

Project Management in Practice

Authors: Samuel J. Mantel Jr., Jack R. Meredith, Sco

4th edition

470533013, 978-0470533017

More Books

Students also viewed these General Management questions