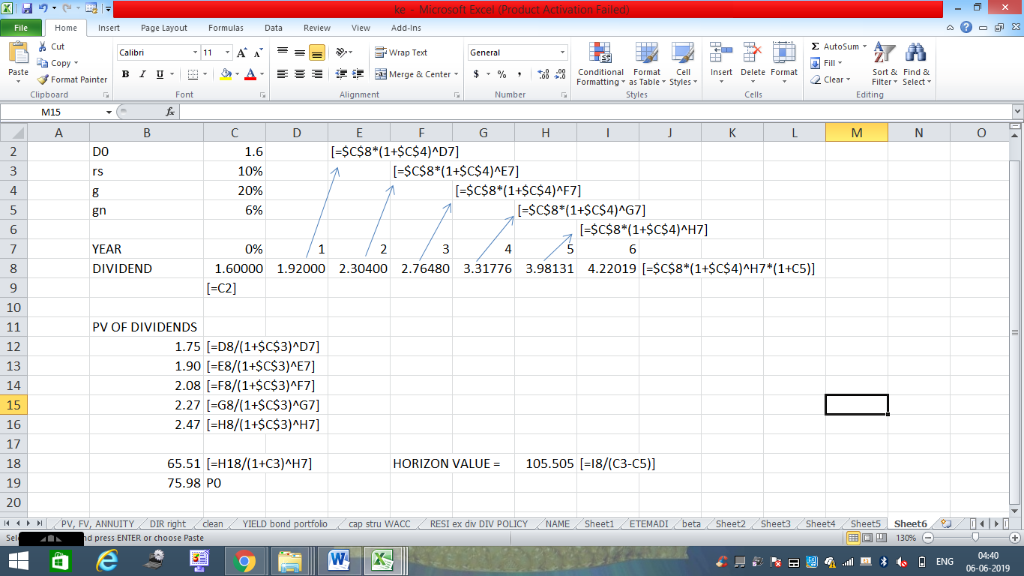
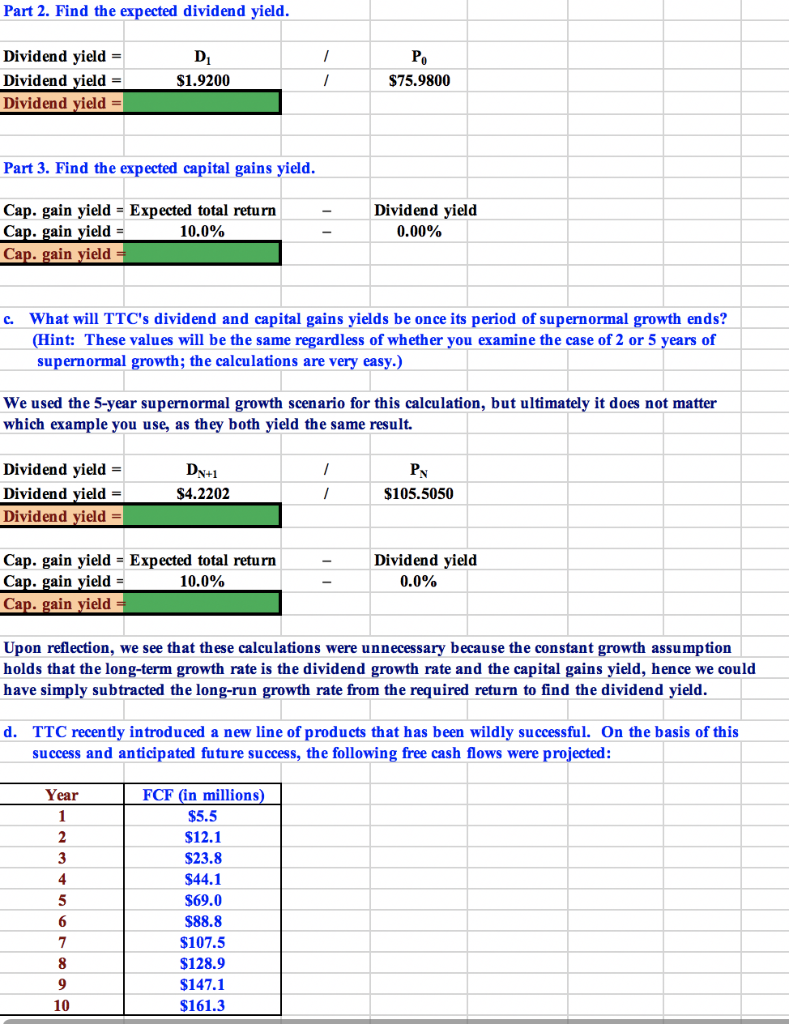
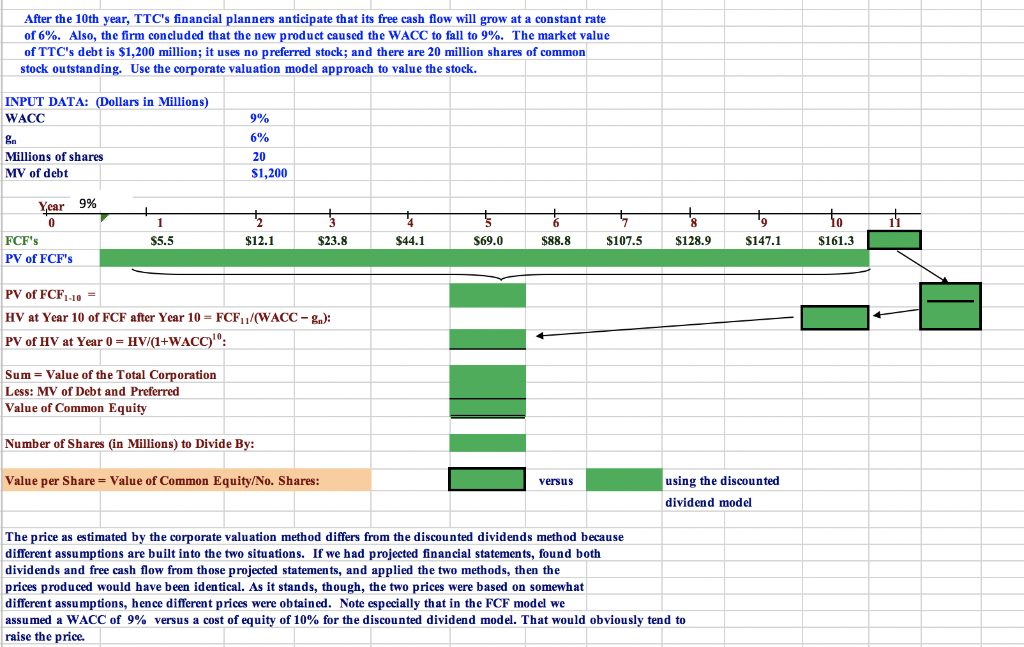
*** First image below is only to assist with answering the GREEN CELLS in bottom two images. ***

***** NEED ANSWERS TO GREEN CELLS IN TWO IMAGES BELOW *****
** GREEN CELLS ONLY **


File Home Insert Page Layout Formulas Data Review View Add-Ins - Cut AutoSum A A Wrap Text Calibri 11 General Fill Copy A Merge & Center Conditional Format Insert Delete Format Paste BIU Cell Sort & Find & 2 Clear Format Painter ble Styles er Select Formatting Clipboard Font Alignment Number Shules Cells Editing M15 A C G K M N C [=$C$8*(1+$C$4)^D7] 2 DO 1.6 10% -SC$8*(1+$C$4)^E7] rs [-$C$8*(1+$C$4)^F7] 20% -$C$8*(1+SC$4)^G7] 6% gn [=SC$8*(1+$C$4)^H7] 6 7 YEAR 0% 3 4 1 6 2.76480 3.31776 3.98131 4.22019 [-SC$8*(1+$C$4)^H7*(1+C5)] DIVIDEND 8 1.60000 1.92000 2,30400 (C2] 10 11 PV OF DIVIDENDS 1.75 D8/(1+$c$3)^D7] 12 1.90 E8/(1+SC$3)^E7] 2.08 F8/(1+SC$3)^F7] 13 14 2.27 [G8/(1+SC$3)^G7] 2.47 H8/1+$C$3)^H7] 15 16 17 65.51 [-H18/(1+C3) ^H7] 105.505 18/(C3-C5)] 18 HORIZON VALUE 19 75.98 PO 20 PV, FV, ANNUITY DIR right Sheet1 ETEMADI beta Sheet2 Sheet3Sheet4 Sheets Sheet6 RESI ex dv DIV POLICY clean YIELD bond portfolo stru WACC NAME 130% Se d press ENTER or choose Paste W 04:40 | 4l m 4s AENG 06-06-2019 Part 2. Find the expected dividend yield. Dividend yield D Po Dividend yield | $1.9200 S75.9800 Dividend yield = Part 3. Find the expected capital gains yield. Dividend yield Cap. gain yield = Expected total return Cap. gain yield = Cap. gain yield = 10.0% 0.00% What will TTC's dividend and capital gains yields be once its period of supernormal growth ends? (Hint: These values will be the same regardless of whether you examine the case of 2 or 5 years of supernormal growth; the calculations are very easy.) c. We used the 5-year supernormal growth scen ario for this cal cu lation, but ultimately it does not matter which example you use, as they both yield the same result. Dividend yield =| Dividend yield =| Dividend yield =| $4.2202 $105.5050 Dividend yield Cap. gain yield = Expected total return Cap. gain yield = Cap. gain yield = 0.0% 10.0% Upon reflection, we see that these calculations were unnecessary because the constant growth assumption holds that the long-term growth rate is the dividend growth rate and the capital gains yield, hence we could have simply subtracted the long-run growth rate from the required return to find the dividend yield. TTC recen tly introduced a new line of products that has been wildly successful. On the basis of this d. success and anticip ated future success, the following free cash flows were projected: FCF (in millions) Year 1 $5.5 2 $12.1 $23.8 3 4 $44.1 5 $69.0 $88.8 $107.5 $128.9 $147.1 10 $161.3 After the 10th year, TTC's financial planners anticipate that its free cash flow will grow at of 6%. Also, the firm concluded that the new product caused the WACC to fall to 9% . The market value constant rate of TTC's debt is $1,200 million; it uses no preferred stock; and there are 20 million shares of common stock outstanding. Use the corporate valuation model approach to value the stock INPUT DATA: (Dollars in Million s) WACC 9% 6% ga Millions of shares 20 MV of debt S1,200 9% Year 10 1 0 $44.1 $161.3 $23.8 $88.8 $128.9 $147.1 FCF's S5.5 $12.1 $69,0 $107.5 PV of FCF's PV of FCF110 HV at Year 10 of FCF after Year 10 FCF11/(WACC g): HV/(1+WACC)0: PV of HV at Year 0 Sum = Value of the Total Corporation Less: MV of Debt and Preferred Value of Common Equity Number of Shares (in Millions) to Divide By: using the discounted Value per Share = Value of Common Equity/No. Shares: versus dividend model The price as estimated by the corporate valuation method differs from the discounted dividends method because different assumptions are built into the two situations. If we had projected financial statements, found both dividends and free cash flow from those projected statements, and applied the two methods, then the |prices produced would have been identical. As it stands, though, the two prices were based on somewhat different assumptions, hence different prices were obtained. Note especially th at in the FCF model we assumed a WACC of 9% versu cost of equity of 10% for the discounted dividend model. That would obviously tend to raise the price


