

Question
First off, how can I display both of these tables on the screen at the same time, without having to choose between each tab? Second,
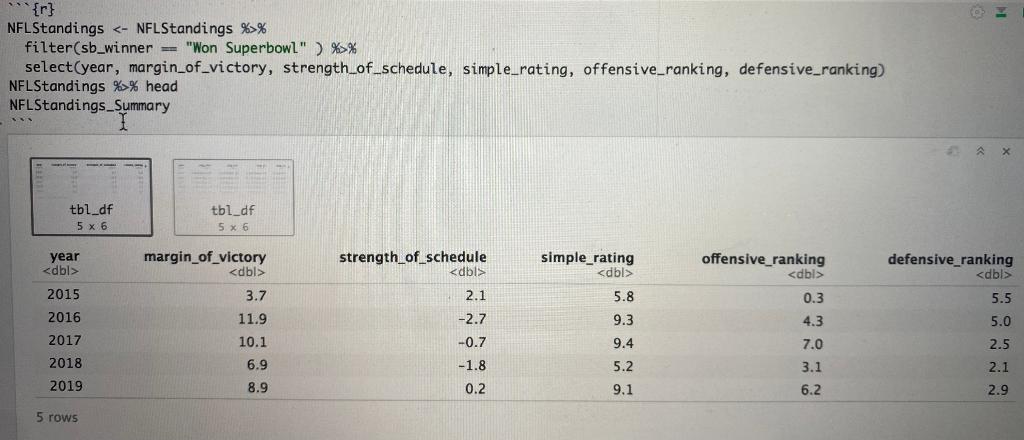
First off, how can I display both of these tables on the screen at the same time, without having to choose between each tab? Second, how can I put each of the statistics from these two tables on the same graph? I want to compare the two tables, one showing the averages of each statistic and one showing the statistics for the super bowl winner of each year. This is in R. Please help, I am struggling.
Step by Step Solution
There are 3 Steps involved in it
Step: 1

Get Instant Access to Expert-Tailored Solutions
See step-by-step solutions with expert insights and AI powered tools for academic success
Step: 2

Step: 3
Ace Your Homework with AI
Get the answers you need in no time with our AI-driven, step-by-step assistance
Get Started
Database Concepts
Authors: David M Kroenke, David J Auer
6th Edition
0132742926, 978-0132742924