

Question
First questions asks which bar chart shows the given distribution (majors). The correct answer is cAnd last question asks which of the following is the
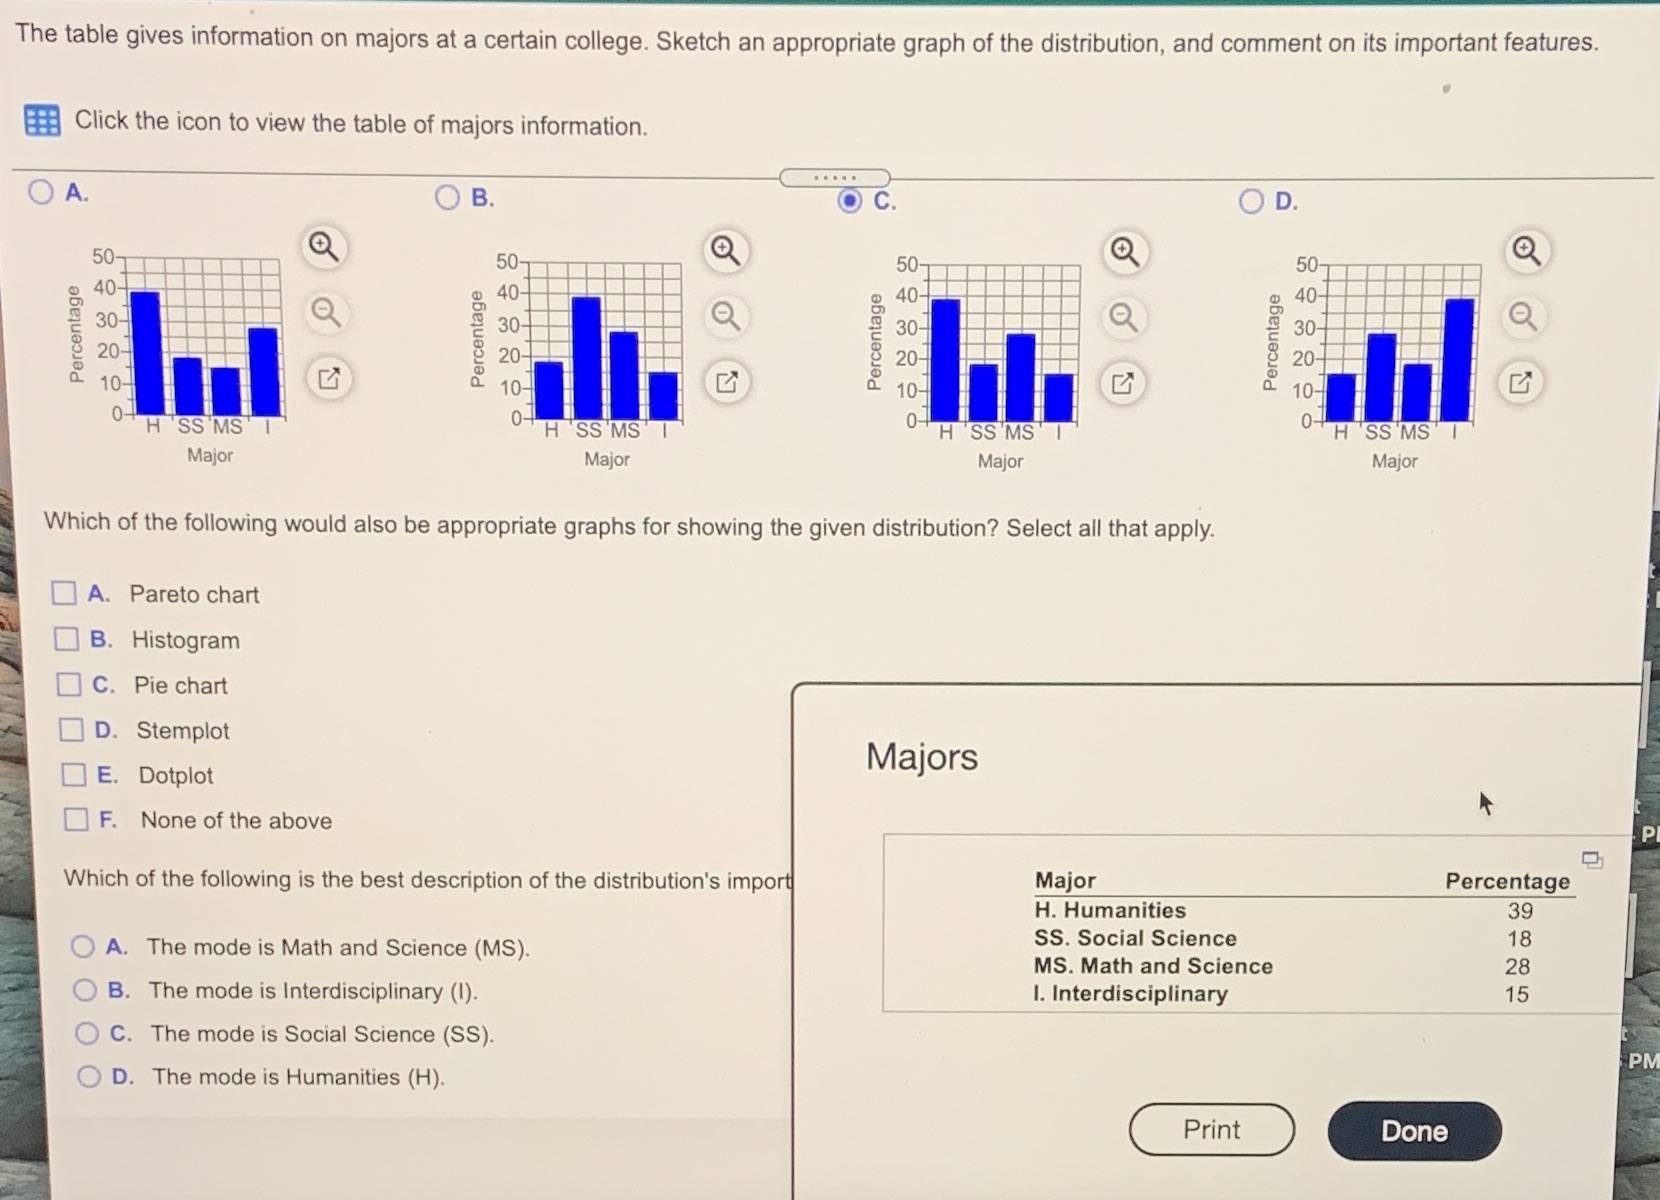
First questions asks which bar chart shows the given distribution (majors). The correct answer is cAnd last question asks which of the following is the best description of the distributions important features A. Mode is Math and ScienceB. Mode is Interdisciplinary C. Mode is Social ScienceD. Mode is Humanities
Step by Step Solution
There are 3 Steps involved in it
Step: 1

Get Instant Access to Expert-Tailored Solutions
See step-by-step solutions with expert insights and AI powered tools for academic success
Step: 2

Step: 3
Ace Your Homework with AI
Get the answers you need in no time with our AI-driven, step-by-step assistance
Get Started
Interconnection Networks
Authors: J C Bermond
1st Edition
1483295273, 9781483295275