

Question: First, review the Module Six resources and Chapter 10 in the textbook. For this practice activity, we will use the End of Chapter exercise from
First, review the Module Six resources and Chapter 10 in the textbook. For this practice activity, we will use the End of Chapter exercise from pp. 703704: 10.11 Identifying the Cost Structure and Projecting Gross Margins for Capital-Intensive, Cyclical Businesses. This includes the AK Steel case study. After reading the case study, answer questions AD below. Refer to the textbook and other course materials to support your responses.
- Cost Structure: Compute the cost structure for each firm. You will need to calculate three variables for both companies:
- Variable Cost per Dollar of Sales = Change in Cost of Products Sold / Change in Sales:
- Total Variable Cost = Variable Cost per Dollar of Sales * Sales:
- Total Fixed Cost = Total Cost of Product Sold Total Variable Cost:
- Structure of Manufacturing Cost: In one paragraph, compare the structure of manufacturing costs for each firm:
- Projected Financial Information: Compute the projected sales, cost of products sold, gross profit, and gross margin (gross profit as a percentage of sales) of each firm for Year +1 through Year +5. Using the table below or a similar spreadsheet is recommended.
| AK Steel | Year +1 | Year +2 | Year +3 | Year +4 | Year +5 |
| Sales | |||||
| Less Cost of Product Sold: Variable Cost (0.568 of Sales) | |||||
| Fixed Costs | |||||
| Total Costs of Products Sold | |||||
| Gross Profit | |||||
| Gross Margin % | |||||
| Nucor | Year +1 | Year +2 | Year +3 | Year +4 | Year +5 |
| Sales | |||||
| Less Cost of Product Sold: Variable Cost (0.613 of Sales) | |||||
| Fixed Costs | |||||
| Total Costs of Products Sold | |||||
| Gross Profit | |||||
| Gross Margin % | |||||
- Gross Margin Comparison: In one to two paragraphs, explain why the levels and variability of the gross margin percentages differ for these two firms for Year +1 through Year +5. Provide an example comparing the effect of the change in gross margin. (For example, if gross margin changed from 25% to 35%, what would it mean for each company?)
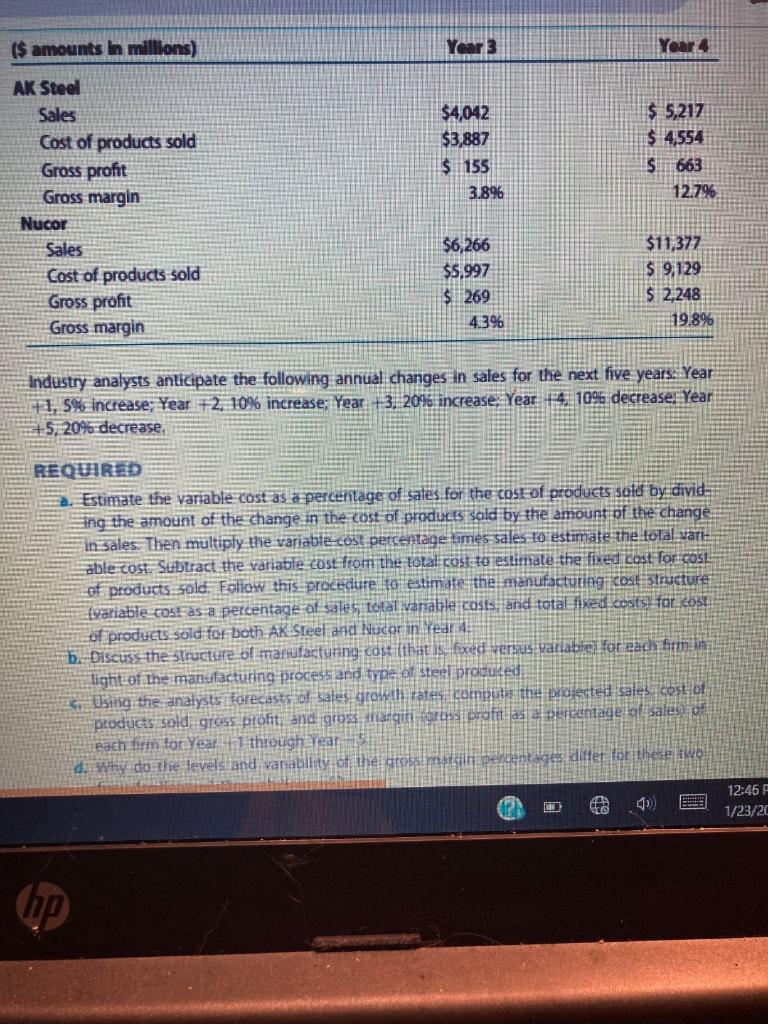
($ amounts in millions) Year 3 Year 4 $4,042 $3,887 $ 155 3.896 $ 5,217 $ 4,554 S663 12.79 AK Steel Sales Cost of products sold Gross profit Gross margin Nucor Sales Cost of products sold Gross profit Gross margin $6,266 $5,997 $ 269 4.396 $11,377 $ 9,129 $ 2,248 19.8% Industry analysts anticipate the following annual changes in sales for the next five years: Year 1,5% increase: Year +2 10% increase; Year 3, 20% increase Year. 14. 1096 decrease: Year +5, 20% decrease. REQUIRED Estimate the variable cost as a percentage of sales for the cost of products sold by divid ing the amount of the change in the cost of products sold by the amount of the change in sales. Then multiply the variable-cost percentage times sales to estimate the total vari able cost. Subtract the variable cost from the total cost to estimate the fixed cost for COSE of products sold. Follow this procedure to estimate the manufacturing cost structure fvariable cose as a percentage of sales, total variable costs, and total fixed costs for cost of products sold for both AK steel and Nucor in Year 4 b. Discuss the structure of ning cost that is fixed versus variable for each firmi light of the manufacturing process and type of steel produced Ostrig the analysts forecasts of sales growth rates compute the protected sales cost of products sold gress profit and gross tragitt rosa profil as a percentage of sales of each firm for Year 1 through Year d. Why do the levels and vanability of the teamardin perdent es difter for these two 12:46 1/23/20 hp ($ amounts in millions) Year 3 Year 4 $4,042 $3,887 $ 155 3.896 $ 5,217 $ 4,554 S663 12.79 AK Steel Sales Cost of products sold Gross profit Gross margin Nucor Sales Cost of products sold Gross profit Gross margin $6,266 $5,997 $ 269 4.396 $11,377 $ 9,129 $ 2,248 19.8% Industry analysts anticipate the following annual changes in sales for the next five years: Year 1,5% increase: Year +2 10% increase; Year 3, 20% increase Year. 14. 1096 decrease: Year +5, 20% decrease. REQUIRED Estimate the variable cost as a percentage of sales for the cost of products sold by divid ing the amount of the change in the cost of products sold by the amount of the change in sales. Then multiply the variable-cost percentage times sales to estimate the total vari able cost. Subtract the variable cost from the total cost to estimate the fixed cost for COSE of products sold. Follow this procedure to estimate the manufacturing cost structure fvariable cose as a percentage of sales, total variable costs, and total fixed costs for cost of products sold for both AK steel and Nucor in Year 4 b. Discuss the structure of ning cost that is fixed versus variable for each firmi light of the manufacturing process and type of steel produced Ostrig the analysts forecasts of sales growth rates compute the protected sales cost of products sold gress profit and gross tragitt rosa profil as a percentage of sales of each firm for Year 1 through Year d. Why do the levels and vanability of the teamardin perdent es difter for these two 12:46 1/23/20 hp
Step by Step Solution
There are 3 Steps involved in it

Get step-by-step solutions from verified subject matter experts