Question
First, what is the annual operating cash flow of the project for year 1? What is the annual operating cash flow of the project for

First, what is the annual operating cash flow of the project for year 1?
What is the annual operating cash flow of the project for year2?
What is the annual operating cash flow of the project for year3?
What is the annual operating cash flow of the project for year4?
What is the annual operating cash flow of the project for year5?
Next, what is the after-tax cash flow of the equipment atdisposal?
Then, what is the incremental cash flow of the project in year0?
What is the incremental cash flow of the project in year1?
What is the incremental cash flow of the project in year2?
What is the incremental cash flow of the project in year3?
What is the incremental cash flow of the project in year4?
W hat is the incremental cash flow of the project in year5?
So, what is the IRR of the project?
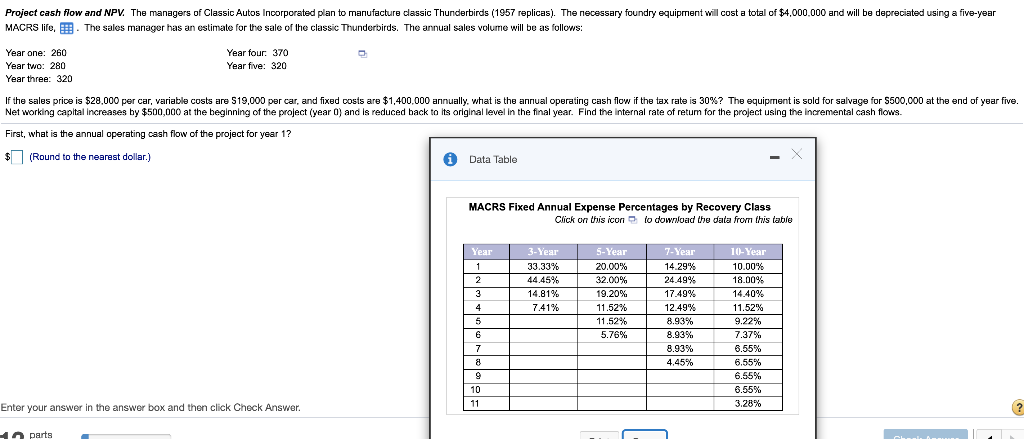
Project cash flow and NPV. The managers of Classic Autos Incorporated plan to manufacture dassic Thunderbirds (1957 replicas). The necessary foundry equipment will cost a total of $4,000,000 and will be depreciated using a five-year MACRS life. The sales manager has an estimale for the sale of the classic Thunderbirds. The annual sales volume will be as follows: Year one: 260 Year two: 280 Year three: 320 Year four: 370 Year five: 320 If the sales price is $28.000 per car, variable costs are 519,000 per car, and fixed costs are $1,400,000 annually, what is the annual operating cash flow if the tax rate is 30%? The equipment is sold for salvage for $500,000 at the end of year five. Net working capital increases by $500,000 at the beginning of the project (year ) and is reduced back to its original level in the final year. Find the internal rate of retum for the project using the incremental cash flows. First, what is the annual operating cash flow of the project for year 1? $(Round to the nearest dollar.) A Data Table MACRS Fixed Annual Expense Percentages by Recovery Class Click on this icon to download the data from this table Year 1 3-Year 33.33% 44.45% 14.81% 7.41% 5-Year 20.00% 32.00% 19.20% 11.52% 11.52% 5.76% 2 3 4 5 6 7 8 9 10 11 7-Year 14.29% 24.49% 17.49% 12.49% 8.93% 8.93% 8.93% 4.45% 10-Year 10.00% 18.00% 14.40% 11.52% 9.22% 7.37% 8.55% 6.55% 6.55% 6.55% 3.28% Enter your answer in the answer box and then click Check Answer. ? partsStep by Step Solution
There are 3 Steps involved in it
Step: 1

Get Instant Access to Expert-Tailored Solutions
See step-by-step solutions with expert insights and AI powered tools for academic success
Step: 2

Step: 3

Ace Your Homework with AI
Get the answers you need in no time with our AI-driven, step-by-step assistance
Get Started


