

Answered step by step
Verified Expert Solution
Question
1 Approved Answer
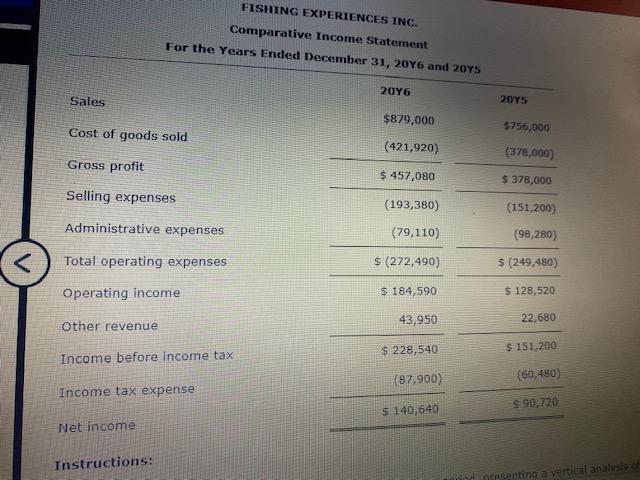
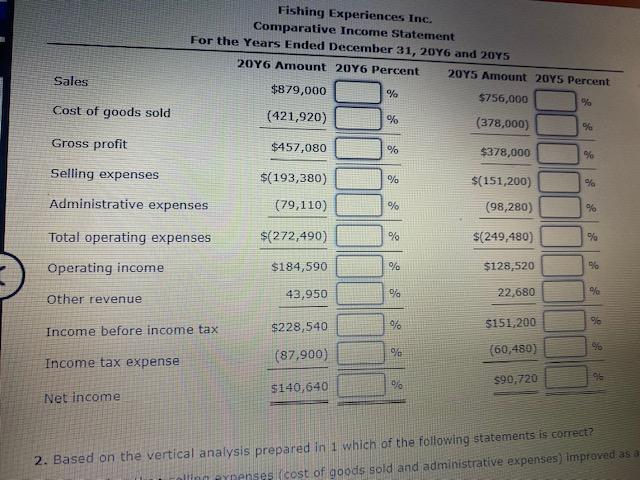
FISHING EXPERIENCES INC. Comparative Income Statement For the Years Ended December 31, 2016 and 2015 2016 Sales 2015 $879,000 $756,000 Cost of goods sold (421,920)
Step by Step Solution
There are 3 Steps involved in it
Step: 1

Get Instant Access to Expert-Tailored Solutions
See step-by-step solutions with expert insights and AI powered tools for academic success
Step: 2

Step: 3
Ace Your Homework with AI
Get the answers you need in no time with our AI-driven, step-by-step assistance
Get Started
Advanced Financial Reporting And Analysis
Authors: John Dunn, Margaret Stewart
1st Edition
0470973609, 9780470973608