

Question
Flag In the spring of 2015, Jemison Electric was considering an investment in a new distribution center. Jemison's CFO anticipates additional earnings before interest and
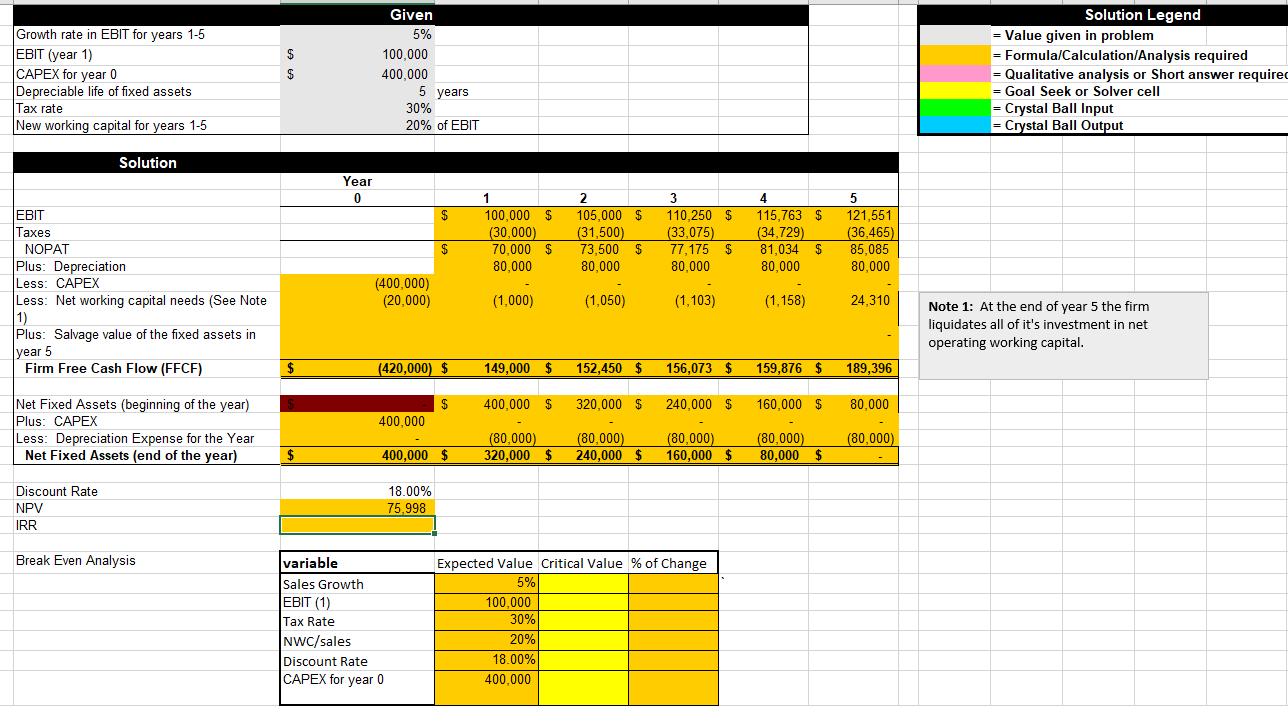
Flag In the spring of 2015, Jemison Electric was considering an investment in a new distribution center. Jemison's CFO anticipates additional earnings before interest and taxes (EBIT) of $100,000 for the first year of operation of the center, and, over the next five years, the firm estimates that this amount will grow at a rate of 5% per year. The distribution center will require an initial investment of $400,000 that will be depreciated over a five-year period toward a zero salvage value using straight-line depreciation of $80,000 per year. Jemison's CFO estimates that the distribution center will need additional net working capital equal to 20% of new EBIT Assuming the firm faces a 30% tax rate; calculate the project's annual project free cash flow (FCF) for each of the next five years where the salvage value of operating networking capital and fixed assets is assumed to equal their book values, respectively. Fill out chart below. The questions I need answered are: If the discount rate is 18%, what is the NPV of this project? What is the IRR? Conduct a break-even sensitivity analysis and identify the top 3 value drivers And more than just the number, I need to know what cell references you used to get the answer you got!
Step by Step Solution
There are 3 Steps involved in it
Step: 1

Get Instant Access to Expert-Tailored Solutions
See step-by-step solutions with expert insights and AI powered tools for academic success
Step: 2

Step: 3
Ace Your Homework with AI
Get the answers you need in no time with our AI-driven, step-by-step assistance
Get Started
Accounting For Inventory
Authors: Steven M. Bragg
1st Edition
1938910222, 9781938910227