fnnfgnfg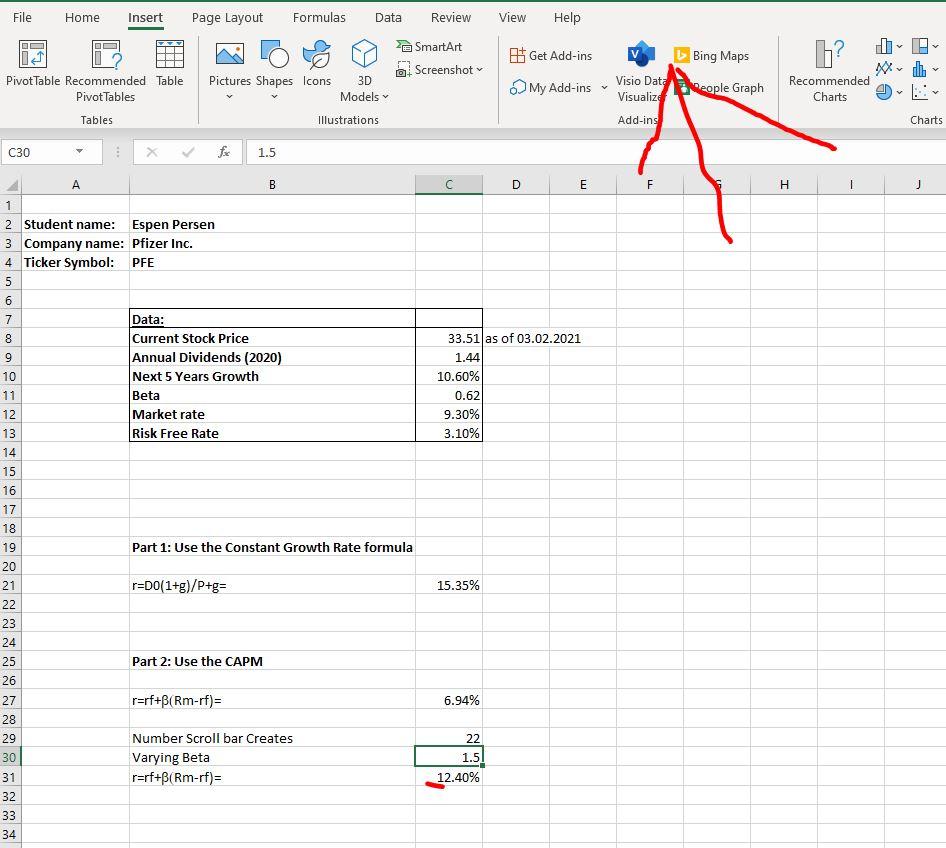
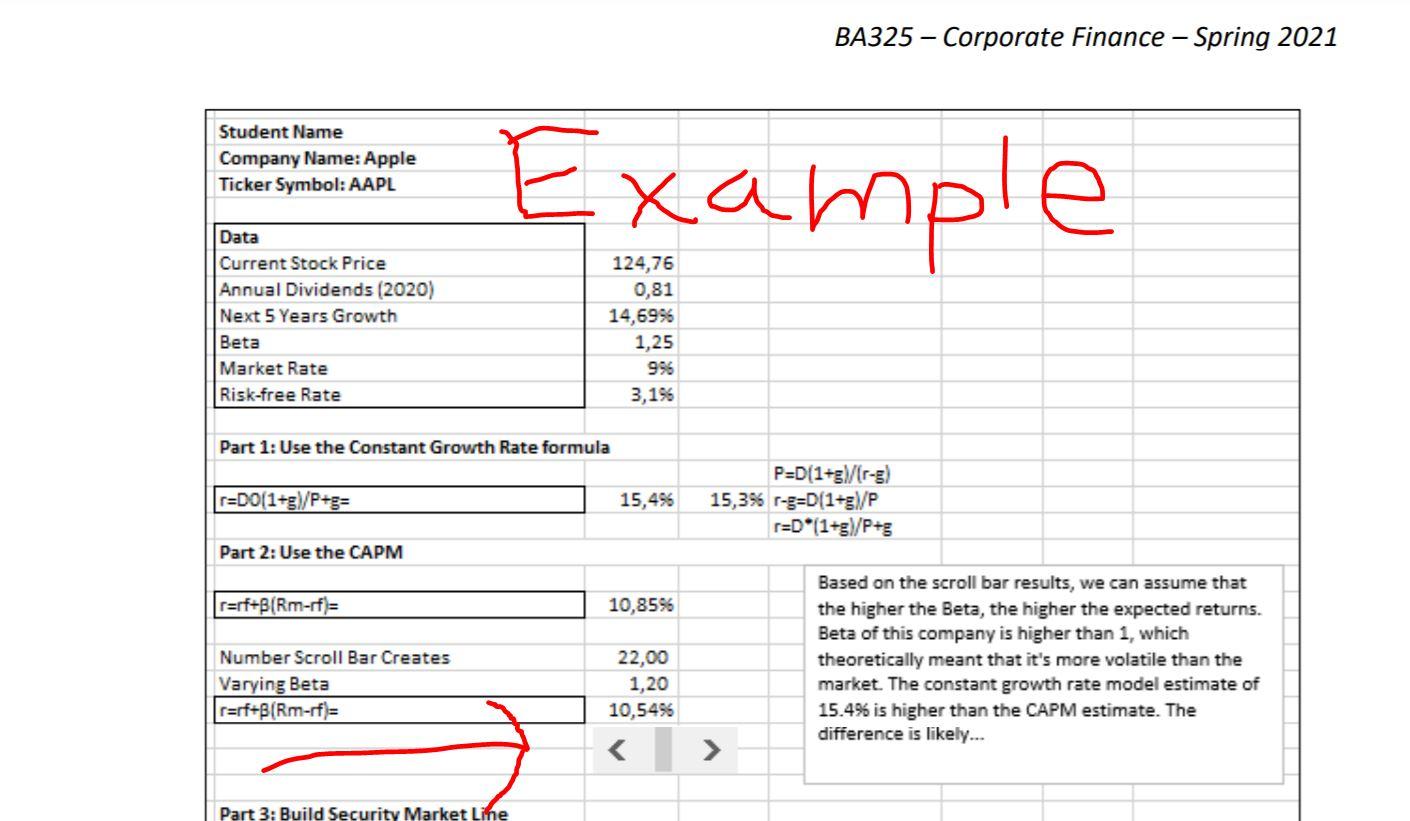
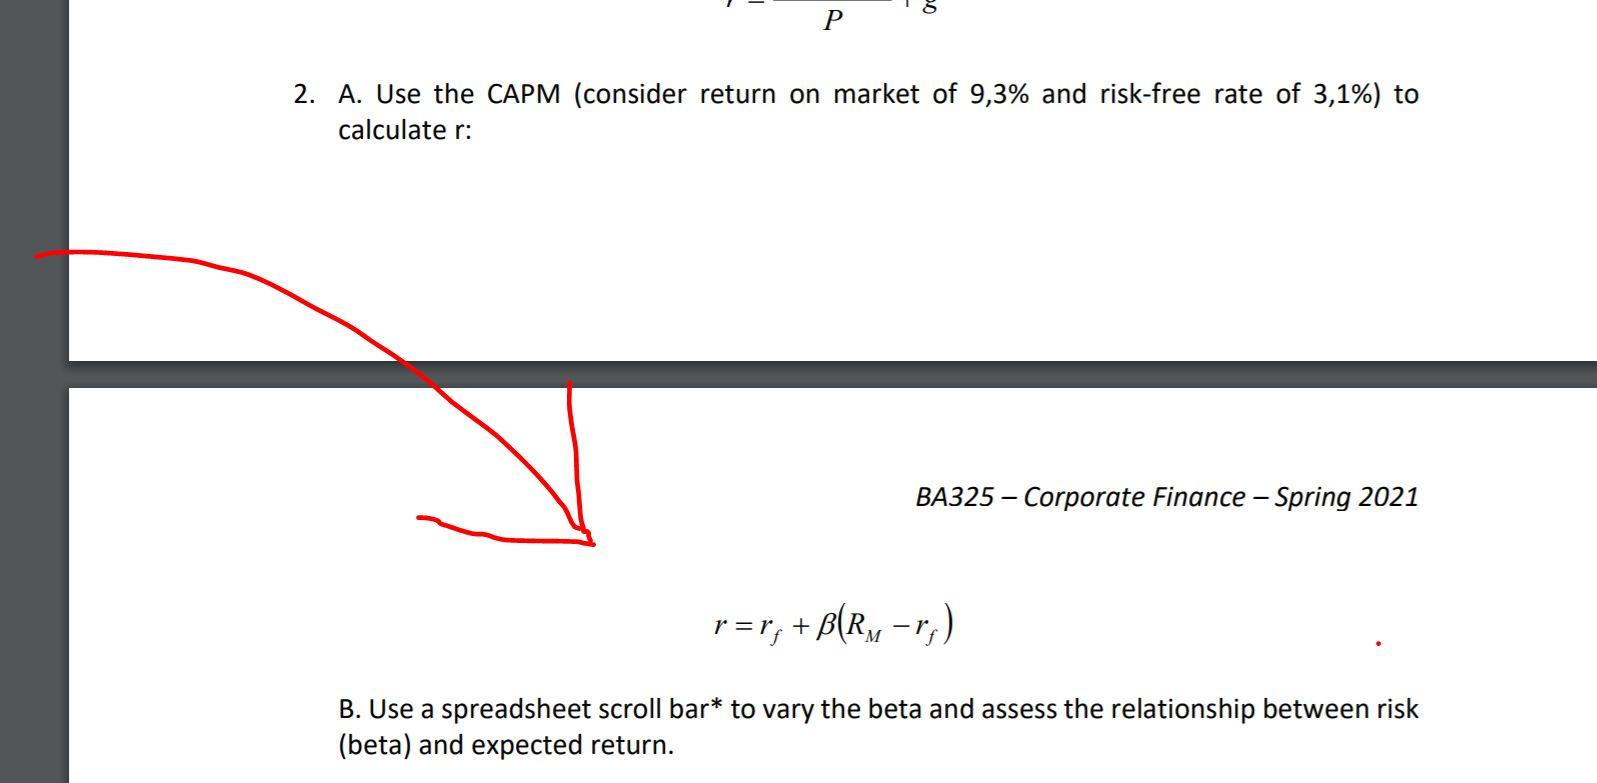
File Home Insert Page Layout Formulas Data Review View Help Y SmartArt Screenshot Bing Maps L? Pictures Shapes Icons Get Add-ins My Add-ins 3D Visio Dataeople Graph Pivot Table Recommended Table Pivot Tables Tables y Recommended Charts Models Visualize Add-ins Illustrations Charts C30 for 1.5 D E F H J A B 1 2 Student name: Espen Persen 3 Company name: Pfizer Inc. 4 Ticker Symbol: PFE 5 6 7 Data: 8 Current Stock Price 9 Annual Dividends (2020) 10 Next 5 Years Growth 11 Beta 12 Market rate 13 Risk Free Rate 14 33.51 as of 03.02.2021 1.44 10.60% 0.62 9.30% 3.10% 15 16 17 18 19 Part 1: Use the Constant Growth Rate formula 20 21 22 r=D0(1+g)/P+g= 15.35% 23 24 25 Part 2: Use the CAPM 26 27 28 r=rf+B(Rm-rf)= 6.94% 29 22 30 Number Scroll bar Creates Varying Beta r=rf+B(Rm-rf)= 1.5 31 12.40% 32 33 34 BA325 Corporate Finance - Spring 2021 Student Name Company Name: Apple Ticker Symbol: AAPL Example Data Current Stock Price Annual Dividends (2020) Next 5 Years Growth Beta Market Rate Risk-free Rate 124,76 0,81 14,69% 1,25 996 3,1% Part 1: Use the Constant Growth Rate formula r=D0[1+)/P+== 15,496 P=D(1+g\/r-g) 15,3% r-=D(1+5)/P r=D*(1+5)/P+g Part 2: Use the CAPM r=rf+BIRm-if) = 10,8596 Number Scroll Bar Creates Varying Beta r=rf+B(Rm-rf)= 22,00 1,20 10,5496 Based on the scroll bar results, we can assume that the higher the Beta, the higher the expected returns. Beta of this company is higher than 1, which theoretically meant that it's more volatile than the market. The constant growth rate model estimate of 15.4% is higher than the CAPM estimate. The difference is likely... > Part 3: Build Security Market Line 2. A. Use the CAPM (consider return on market of 9,3% and risk-free rate of 3,1%) to calculate r: BA325 - Corporate Finance - Spring 2021 r=r, +B(Rx-r,) B. Use a spreadsheet scroll bar* to vary the beta and assess the relationship between risk (beta) and expected return. File Home Insert Page Layout Formulas Data Review View Help Y SmartArt Screenshot Bing Maps L? Pictures Shapes Icons Get Add-ins My Add-ins 3D Visio Dataeople Graph Pivot Table Recommended Table Pivot Tables Tables y Recommended Charts Models Visualize Add-ins Illustrations Charts C30 for 1.5 D E F H J A B 1 2 Student name: Espen Persen 3 Company name: Pfizer Inc. 4 Ticker Symbol: PFE 5 6 7 Data: 8 Current Stock Price 9 Annual Dividends (2020) 10 Next 5 Years Growth 11 Beta 12 Market rate 13 Risk Free Rate 14 33.51 as of 03.02.2021 1.44 10.60% 0.62 9.30% 3.10% 15 16 17 18 19 Part 1: Use the Constant Growth Rate formula 20 21 22 r=D0(1+g)/P+g= 15.35% 23 24 25 Part 2: Use the CAPM 26 27 28 r=rf+B(Rm-rf)= 6.94% 29 22 30 Number Scroll bar Creates Varying Beta r=rf+B(Rm-rf)= 1.5 31 12.40% 32 33 34 BA325 Corporate Finance - Spring 2021 Student Name Company Name: Apple Ticker Symbol: AAPL Example Data Current Stock Price Annual Dividends (2020) Next 5 Years Growth Beta Market Rate Risk-free Rate 124,76 0,81 14,69% 1,25 996 3,1% Part 1: Use the Constant Growth Rate formula r=D0[1+)/P+== 15,496 P=D(1+g\/r-g) 15,3% r-=D(1+5)/P r=D*(1+5)/P+g Part 2: Use the CAPM r=rf+BIRm-if) = 10,8596 Number Scroll Bar Creates Varying Beta r=rf+B(Rm-rf)= 22,00 1,20 10,5496 Based on the scroll bar results, we can assume that the higher the Beta, the higher the expected returns. Beta of this company is higher than 1, which theoretically meant that it's more volatile than the market. The constant growth rate model estimate of 15.4% is higher than the CAPM estimate. The difference is likely... > Part 3: Build Security Market Line 2. A. Use the CAPM (consider return on market of 9,3% and risk-free rate of 3,1%) to calculate r: BA325 - Corporate Finance - Spring 2021 r=r, +B(Rx-r,) B. Use a spreadsheet scroll bar* to vary the beta and assess the relationship between risk (beta) and expected return