Question: fO Mode New Load Save Run Debug REPL Plotter Zoom subproc_Is.py > module7.py > Q7.py > cmapimg.py > 35 # position. To make i correspond
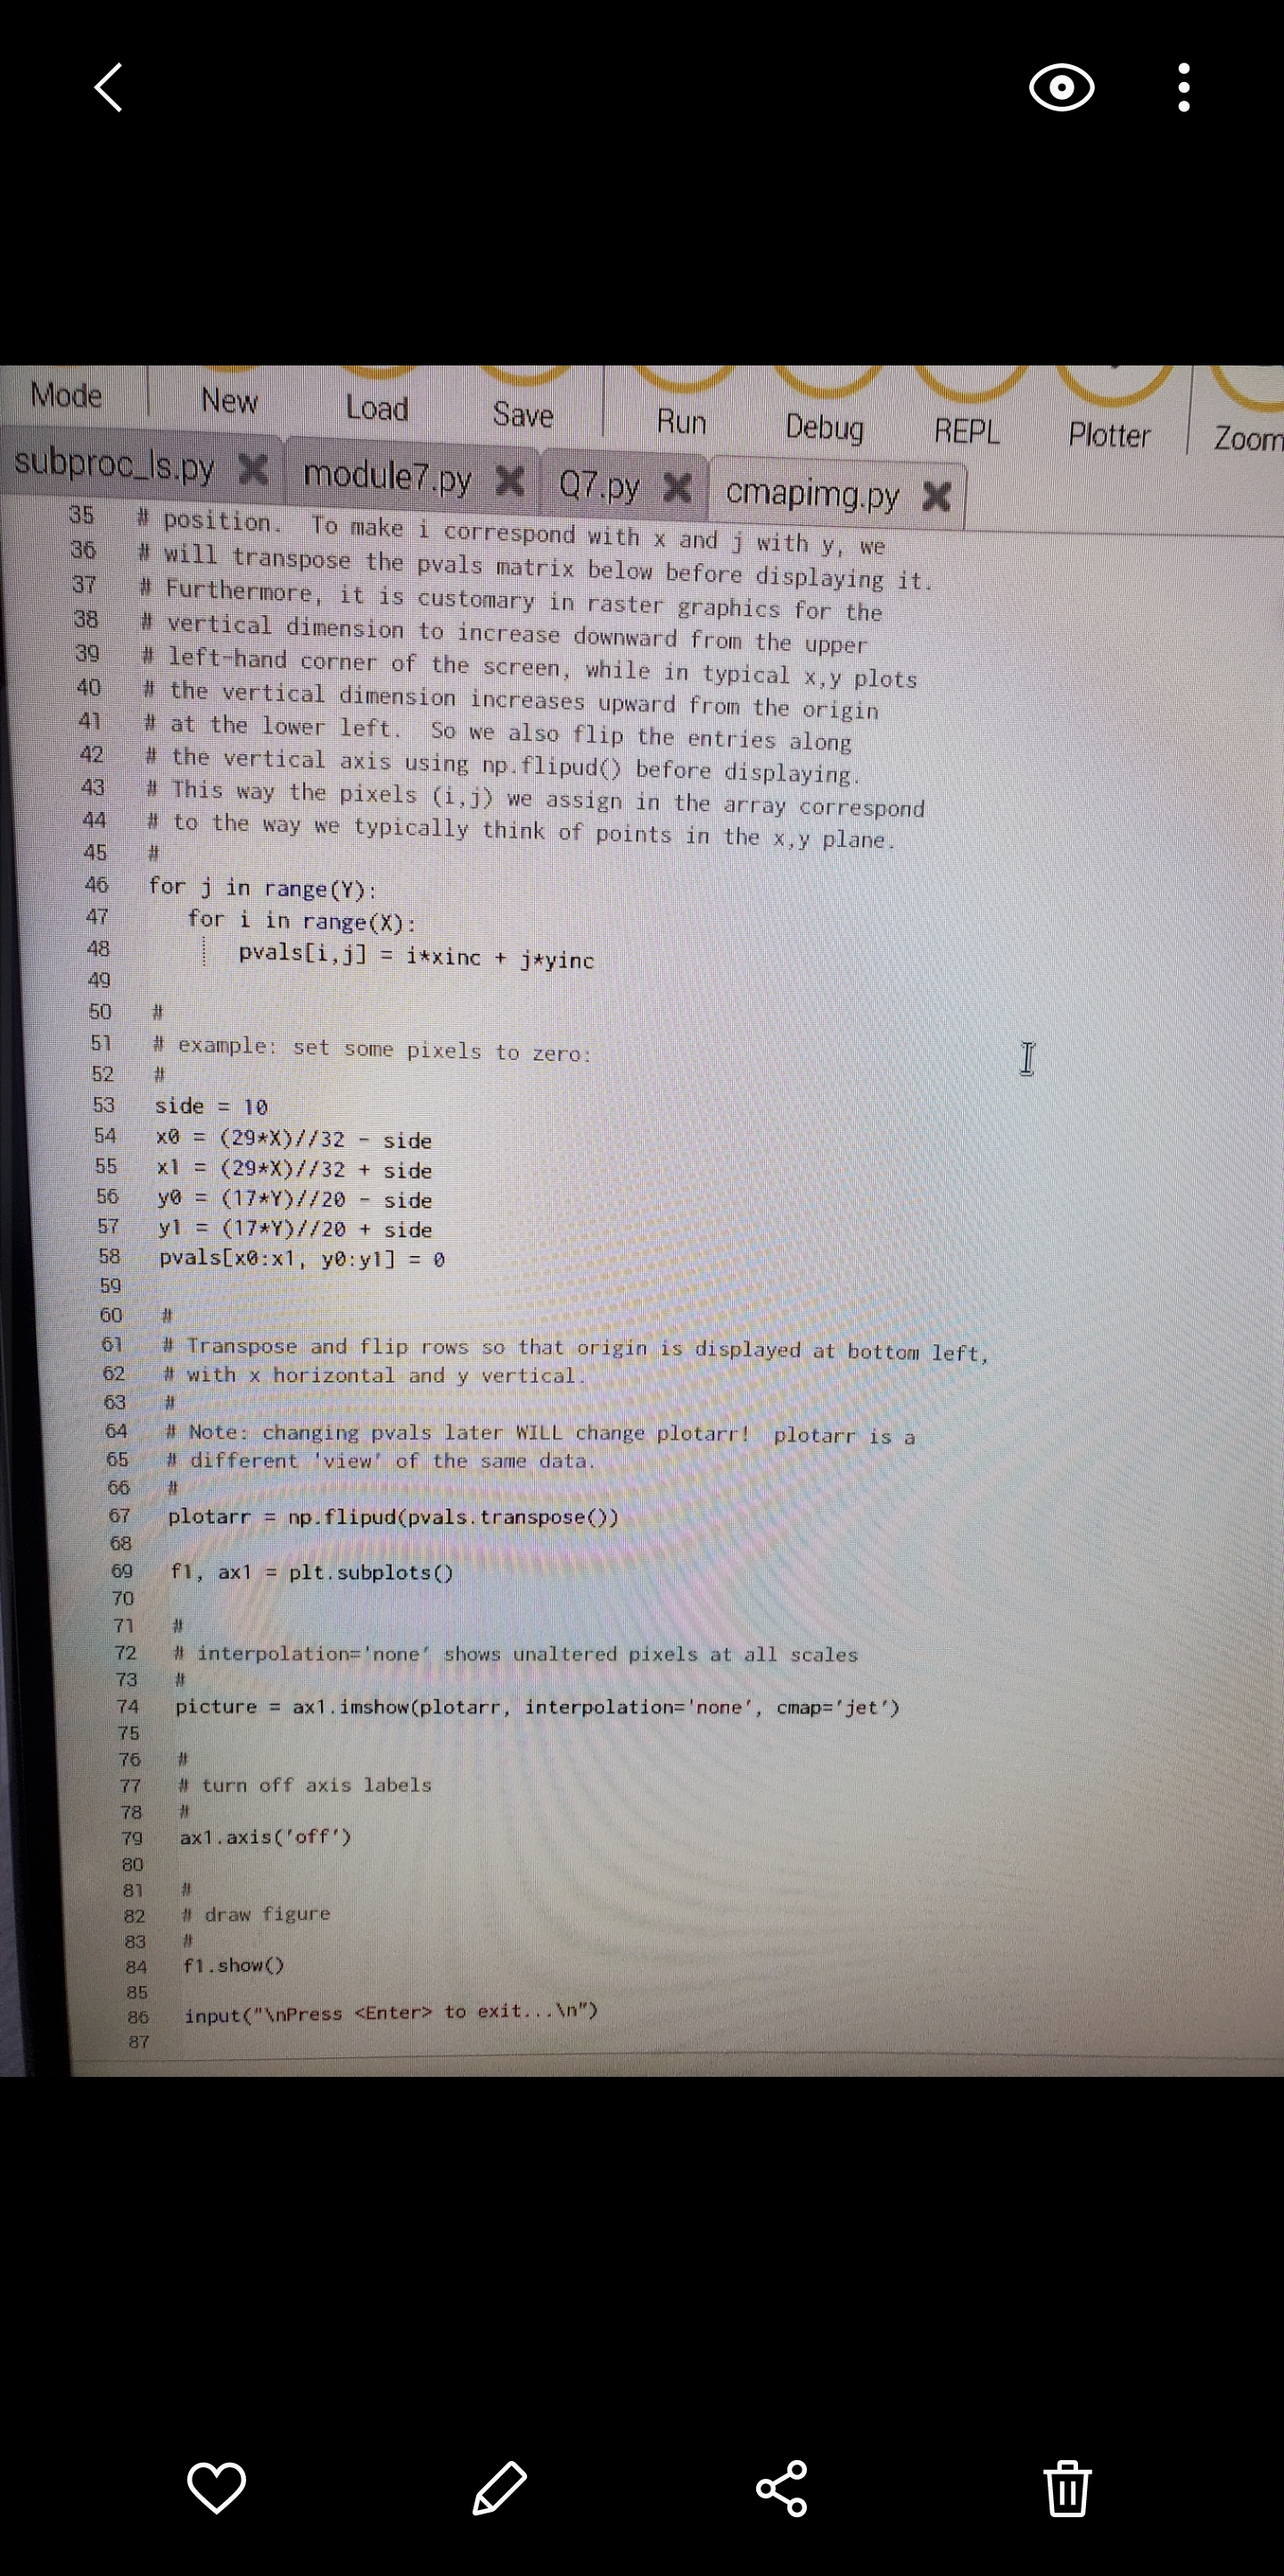
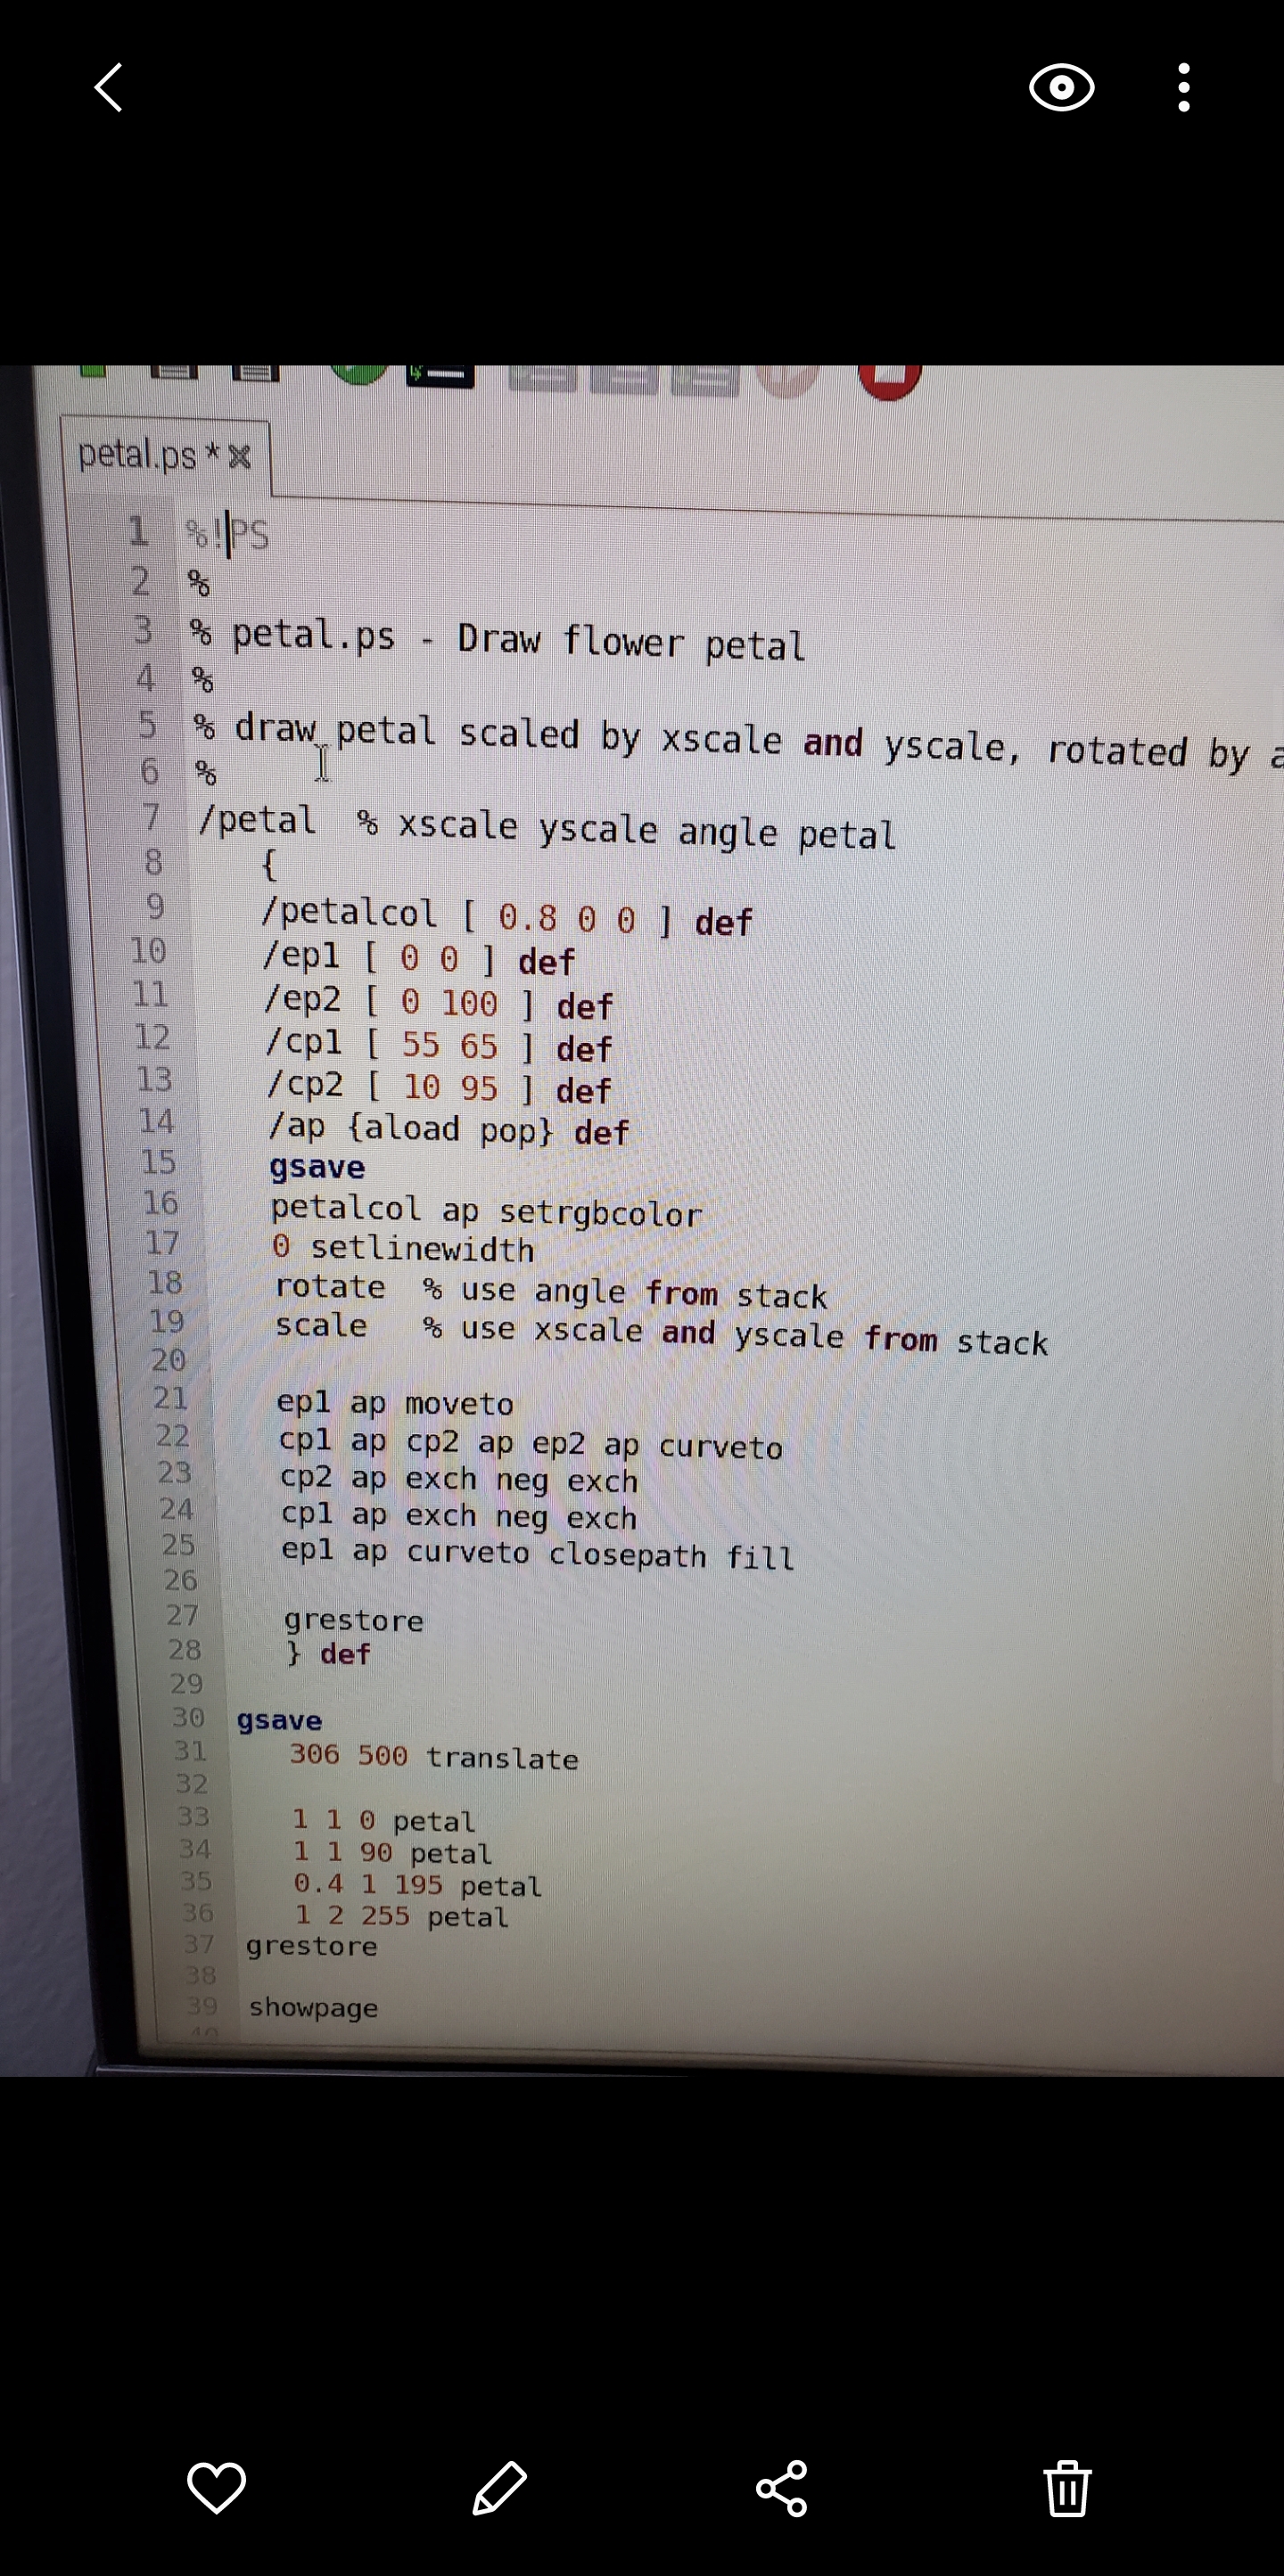
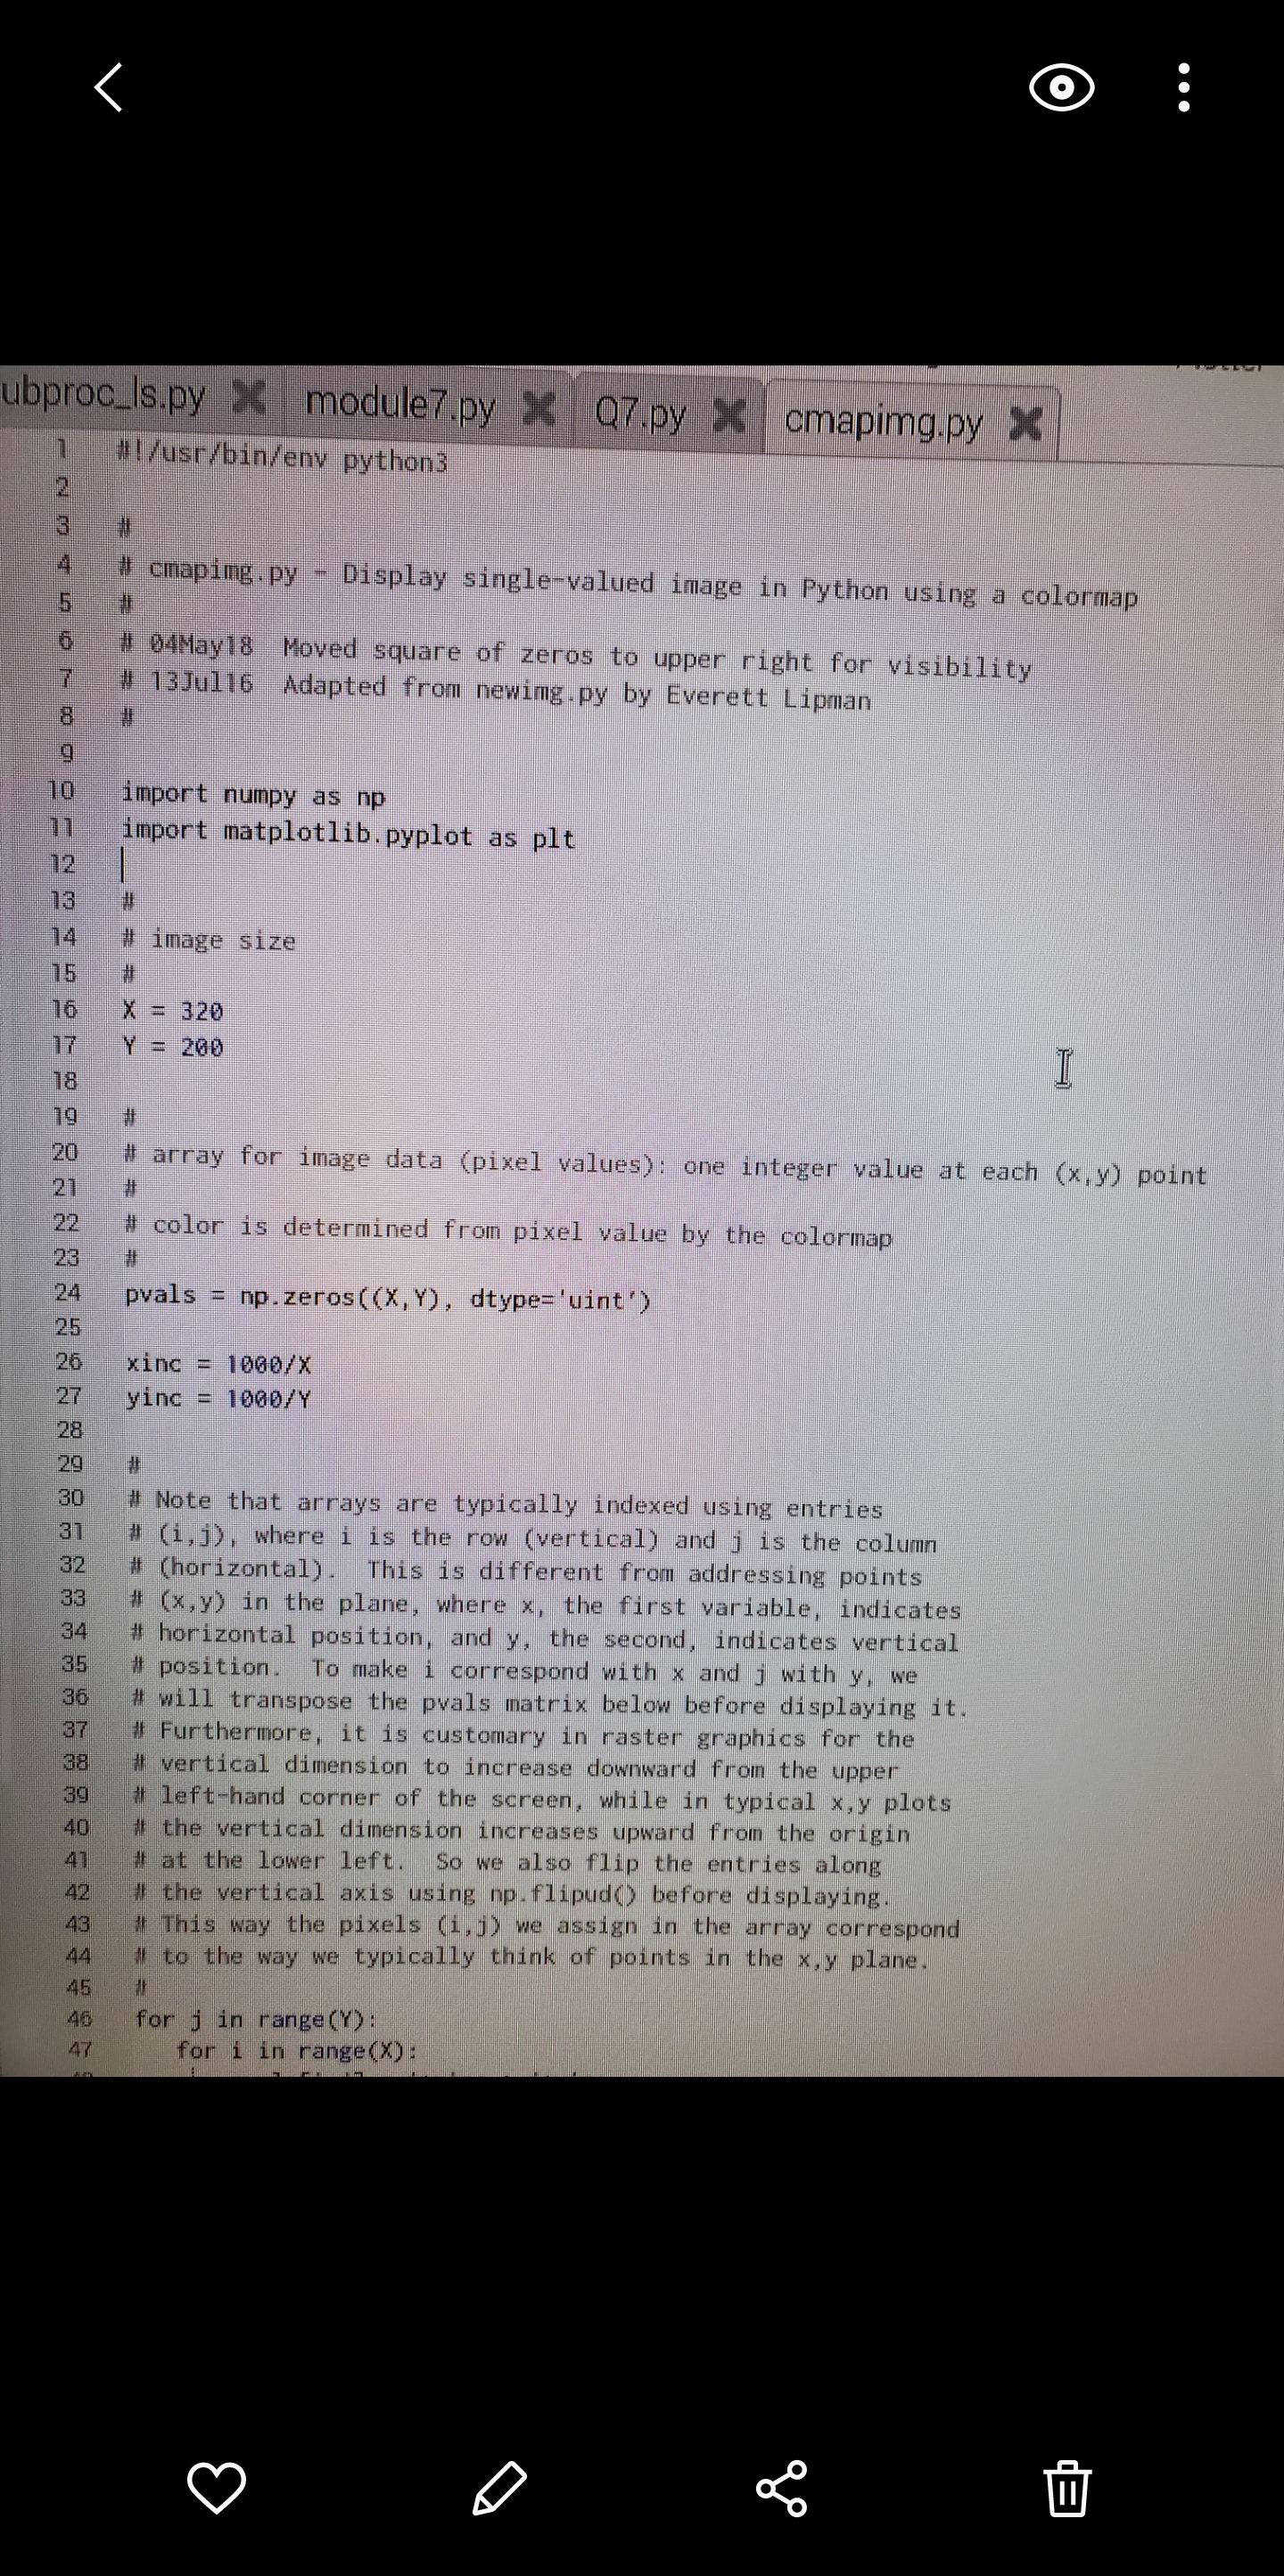
\fO Mode New Load Save Run Debug REPL Plotter Zoom subproc_Is.py > module7.py > Q7.py > cmapimg.py > 35 # position. To make i correspond with x and j with y, we 36 # will transpose the pvals matrix below before displaying it. 37 # Furthermore, it is customary in raster graphics for the 38 # vertical dimension to increase downward from the upper 39 # left-hand corner of the screen, while in typical x,y plots 40 # the vertical dimension increases upward from the origin 41 # at the lower left. So we also flip the entries along 42 # the vertical axis using np. flipud() before displaying. 43 # This way the pixels (i, j) we assign in the array correspond 44 # to the way we typically think of points in the x,y plane. 45 46 for j in range (Y) : 47 for i in range(X) : 48 pvals[i, j] = i*xinc + j*yinc 49 50 57 # example: set some pixels to zero: 52 53 side = 10 54 x0 = (29*X)//32 - side 55 x1 = (29*X) //32 + side 56 yo = (17*Y)//20 - side 57 y1 = (17*Y)//20 + side 58 pvals[x0:x1, y0:yl] = 0 59 60 61 # Transpose and flip rows so that origin is displayed at bottom left, 62 # with x horizontal and y vertical. 63 64 # Note: changing pvals later WILL change plotarr! plotarr is a 65 # different 'view of the same data. 66 67 plotarr = np. flipud(pvals. transpose()) 68 69 f1, ax1 = plt. subplots() 70 71 72 # interpolation#'none" shows unaltered pixels at all scales 73 # 74 picture = ax1. imshow(plotarr, interpolation= 'none', cmap="jet') 75 76 # 77 # turn off axis labels 78 79 ax1 . axis ( 'off ') 80 81 82 # draw figure 83 84 f1 . show() 85 86 input("\\Press to exit.. .\\") 87 IIO petal.ps *x % !PS % petal . ps - Draw flower petal % draw petal scaled by xscale and yscale, rotated by 16 7 /petal % xscale yscale angle petal 8 9 /petalcol [ 0.8 0 0 ] def 10 /ep1 [ 0 0 ] def 11 /ep2 [ 0 100 ] def 12 / cp1 [ 55 65 ] def 13 / cp2 [ 10 95 ] def 14 15 /ap {aload pop} def gsave 16 17 petalcol ap setrgbcolor 0 setlinewidth 18 19 rotate % use angle from stack scale 20 use xscale and yscale from stack 21 ep1 ap moveto 22 23 cpl ap cp2 ap ep2 ap curveto cp2 ap exch neg exch 24 cpl ap exch neg exch 25 ep1 ap curveto closepath fill 26 27 grestore 28 } def 29 30 gsave 31 306 500 translate 32 33 1 1 0 petal 34 1 1 90 petal 35 0. 4 1 195 petal 36 1 2 255 petal 37 grestore 38 39 showpage II4. Mandelbrot Set. A complex number (3 is in the Mandelbrot Serif upon repeated iter ation the expression zn+1 = z + c, with zO = 0, does not diverge. In other words, Iznl remains bounded no matter the value of n. In typical illustrations, the complex plane is shown with the Mandelbrot Set in black and the surrounding points (7 colored according to the number n of iterations required for Iz?I + cl to exceed some chosen value. Write a program that plots an interesting region of the complex plane in this fashion. Note: a region containing the whole set is hardly the most interesting you can choose; try zooming in near the edges. Use a grid of 512x384 pixels, and a limit of 250 iterations per point. In other words, if Iz + cl is still below some small limit of your choosing (think about what a good choice might be) after 250 iterations, assume it is in the set. Save your plot as a PostScript le (not .eps) and use the translate and scale opera- tors to center the image on the page at a size that leaves 56point horizontal margins. A good place to put these commands is immediately following the line %%Page: 1 1 Convert the PostScript le to PDF using psZpdf and turn in the PDF le with the code and text le for the problem. Hints: You will probably nd it useful to use a smaller grid until you have debugged and optimized your code. It will also help to include some print statements that notify you of the program's progress. See cmapimg . py in $HOME/physrpi /python/ on your RPi for an example of plotting points with a color map rather than explicit RGB values. 5. PostScript Flower. Examine the code in $HOME/physrpi/ps/petal.ps on your RPi, and use the gv program to view the result. Write a program in Python that takes as input from the user a number of petals, then writes to disk a PostScript program (a .ps le) that draws a ower with the specied number of nonoverlapping, symmetrically placed petals. Your program may limit the number of petals to some reasonable range. Extra credit will be given for a stem and leaves. Hints: Remember you can use triple quotes to create multipleline strings. Assemble your output as one large string, then use the appropriate le method to write it to disk. You can concatenate strings with +. I suggest you not try to write elegant PostScript code. Do all the work (for example, loops and calculations) in Python, and make the PostScript output as simple as possible. O ubproc_Is.py > cmapimg.py x #1 /usr/bin/env python3 cmaping . py - Display single-valued image in Python using a colormap 6 04May18 Moved square of zeros to upper right for visibility 13Jul16 Adapted from newing. py by Everett Lipman 10 import numpy as np 71 import matplotlib . pyplot as plt 12 13 14 image size 75 16 = 320 17 Y = 200 18 # 20 # array for image data (pixel values): one integer value at each (x,y) point 21 22 # color is determined from pixel value by the colormap 23 24 pvals = np. zeros((X, Y) , dtype= 'uint') 25 26 xinc = 1060/X 27 yinc = 1000/Y 28 29 30 # Note that arrays are typically indexed using entries 31 # (i, j), where i is the row (vertical) and j is the column 32 # (horizontal). This is different from addressing points 33 # (x, y) in the plane, where x, the first variable, indicates 34 # horizontal position, and y, the second, indicates vertical 35 # position. To make i correspond with x and j with y, we 36 # will transpose the pvals matrix below before displaying it. 37 # Furthermore, it is customary in raster graphics for the 38 vertical dimension to increase downward from the upper 39 left-hand corner of the screen, while in typical x,y plots 40 # the vertical dimension increases upward from the origin 41 # at the lower left. So we also flip the entries along 42 the vertical axis using np. flipud() before displaying. 43 This way the pixels (i, j) we assign in the array correspond 44 to the way we typically think of points in the x,y plane. 45 46 for j in range (Y) : 47 for i in range (X) : II