

Answered step by step
Verified Expert Solution
Question
1 Approved Answer
Focus on just the three middle YTD (year-to-date) columns. Discuss the following: How is the organization doing so far compared to its budget? What were
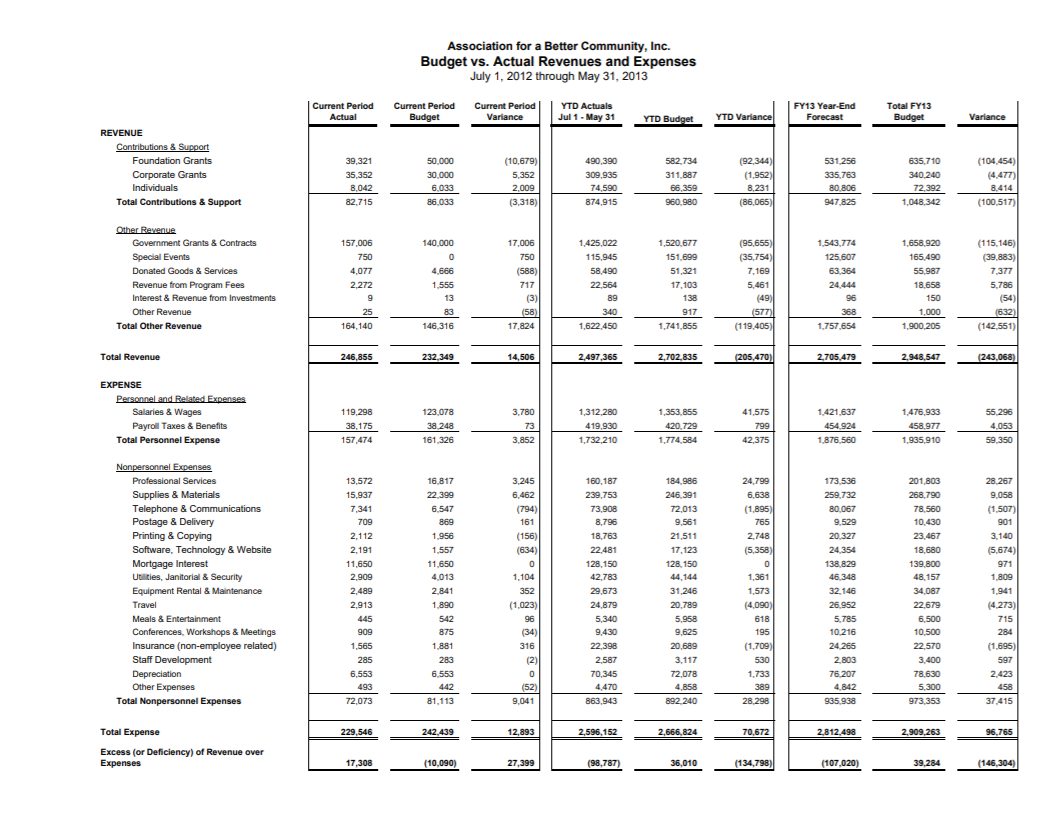
- Focus on just the three middle YTD (year-to-date) columns.
- Discuss the following:
- How is the organization doing so far compared to its budget?
- What were the main reasons for this result?
- What would you investigate further and why?
- Make sure to dig down into specific accounts and not just the broader totals.
Please explain the answer. Thank you.
Association for a Better Community, Inc. Budget vs. Actual Revenues and Expenses July 1, 2012 through May 31, 2013 Current Period Actual Current Period Budget Current Period 1 Variance YTD Actuals Jul 1 - May 31 FY13 Year-End Forecast Total FY13 Budget YTD Budget YTD Variance Variance REVENUE Contributions & Support Foundation Grants Corporate Grants Individuals Total Contributions & Support 39,321 35,352 8,042 82,715 50,000 30.000 6,033 88,033 (10,679) 5.352 2,009 (3,318) 490,390 309,935 74.590 874,915 582.734 311.887 66,359 960,980 (92,344) (1.952 8.231 (86,065) 531.256 335.763 80.806 947825 635.710 340.240 72,392 1,048,342 (104,454) (4.4770 8.414 (100,517) 140.000 Other Revenue Government Grants & Contracts Special Events Donated Goods & Services Revenue from Program Fees Interest & Revenue from Investments Other Revenue Total Other Revenue 157,006 750 4,077 2,272 17,006 750 (588 717 (3) 1.425,022 115.945 58,490 22,564 1,520,677 151.699 51,321 17,103 (95,655) (35,754) 7.169 5.461 (49) (577) (119.405) 1.543.774 125,607 63,364 24.444 4,666 1.555 1.658,920 165.490 55.987 18,658 150 1,000 1,900,205 (115.146) (39,883) 7,377 5.786 138 96 25 (58) 340 1,622,450 917 1,741,855 164,140 368 1,757,654 (632) (142,551) 146,316 17.824 Total Revenue 246,855 232,349 14,506 2.497,365 2,702,835 (205,470) 2,705,479 2 ,948,547 (243,068) EXPENSE Personnel and Related Expenses Salaries & Wages Payroll Taxes & Benefits Total Personnel Expense 3,780 1,353,855 41.575 1.421.637 1,476,933 55.296 119,298 38,175 157,474 123.078 38.248 161,326 1,312,280 419,930 1,732,210 420.729 454924 458.977 4,053 3.852 1,774,584 1.876,560 1,935,910 59,350 3,245 6.462 (794) 161 (156) (634) 24.799 6,638 (1.895 765 2.748 (5.358) 28.267 9.058 (1.507) 901 3.140 (5.674) Nonpersonnel Expenses Professional Services Supplies & Materials Telephone & Communications Postage & Delivery Printing & Copying Software, Technology & Website Mortgage Interest Utilities, Janitorial & Security Equipment Rental & Maintenance Travel Meals & Entertainment Conferences, Workshops & Meetings Insurance (non-employee related) Staff Development Depreciation Other Expenses Total Nonpersonnel Expenses 13,572 15,937 7,341 709 2.112 2,191 11,650 2.909 2.489 2.913 445 909 1.565 285 6,553 16,817 22.399 6,547 869 1,956 1.557 11.650 4,013 2.841 1.890 542 875 1.881 283 6.553 1,104 352 (1,023 160.187 239,753 73,908 8,796 18.763 22,481 128.150 42.783 29,673 24.879 5.340 9.430 22,398 2,587 70,345 4,470 863,943 184.986 246,391 72,013 9,561 21,511 17,123 128.150 44,144 31.246 20,789 5.958 9,625 20,689 3,117 72,078 4,858 892.240 1,361 1,573 (4.090) 173.536 259,732 80,067 9,529 20.327 24,354 138.829 46,348 32.146 26.952 5.785 10.216 24.265 2,803 76.207 4,842 935.938 201.803 268.790 78,560 10.430 23.467 18,680 139,800 48,157 34.087 22.679 6,500 10.500 22.570 3.400 78,630 5,300 973,353 971 1,809 1941 (4.273) 715 618 195 (1.709 284 (1.695 530 597 2.423 493 442 (52) 9,041 1,733 389 28.298 72,073 81,113 37415 Total Expense 229,546 242.439 12,893 2,596,152 2,666,824 70,672 2,812,498 2,909,263 96.765 Excess (or Deficiency) of Revenue over Expenses 17,308 (10,090 27,399 (98,787) 36,010 (134,798) (107,020) 39,284 (146,304) Association for a Better Community, Inc. Budget vs. Actual Revenues and Expenses July 1, 2012 through May 31, 2013 Current Period Actual Current Period Budget Current Period 1 Variance YTD Actuals Jul 1 - May 31 FY13 Year-End Forecast Total FY13 Budget YTD Budget YTD Variance Variance REVENUE Contributions & Support Foundation Grants Corporate Grants Individuals Total Contributions & Support 39,321 35,352 8,042 82,715 50,000 30.000 6,033 88,033 (10,679) 5.352 2,009 (3,318) 490,390 309,935 74.590 874,915 582.734 311.887 66,359 960,980 (92,344) (1.952 8.231 (86,065) 531.256 335.763 80.806 947825 635.710 340.240 72,392 1,048,342 (104,454) (4.4770 8.414 (100,517) 140.000 Other Revenue Government Grants & Contracts Special Events Donated Goods & Services Revenue from Program Fees Interest & Revenue from Investments Other Revenue Total Other Revenue 157,006 750 4,077 2,272 17,006 750 (588 717 (3) 1.425,022 115.945 58,490 22,564 1,520,677 151.699 51,321 17,103 (95,655) (35,754) 7.169 5.461 (49) (577) (119.405) 1.543.774 125,607 63,364 24.444 4,666 1.555 1.658,920 165.490 55.987 18,658 150 1,000 1,900,205 (115.146) (39,883) 7,377 5.786 138 96 25 (58) 340 1,622,450 917 1,741,855 164,140 368 1,757,654 (632) (142,551) 146,316 17.824 Total Revenue 246,855 232,349 14,506 2.497,365 2,702,835 (205,470) 2,705,479 2 ,948,547 (243,068) EXPENSE Personnel and Related Expenses Salaries & Wages Payroll Taxes & Benefits Total Personnel Expense 3,780 1,353,855 41.575 1.421.637 1,476,933 55.296 119,298 38,175 157,474 123.078 38.248 161,326 1,312,280 419,930 1,732,210 420.729 454924 458.977 4,053 3.852 1,774,584 1.876,560 1,935,910 59,350 3,245 6.462 (794) 161 (156) (634) 24.799 6,638 (1.895 765 2.748 (5.358) 28.267 9.058 (1.507) 901 3.140 (5.674) Nonpersonnel Expenses Professional Services Supplies & Materials Telephone & Communications Postage & Delivery Printing & Copying Software, Technology & Website Mortgage Interest Utilities, Janitorial & Security Equipment Rental & Maintenance Travel Meals & Entertainment Conferences, Workshops & Meetings Insurance (non-employee related) Staff Development Depreciation Other Expenses Total Nonpersonnel Expenses 13,572 15,937 7,341 709 2.112 2,191 11,650 2.909 2.489 2.913 445 909 1.565 285 6,553 16,817 22.399 6,547 869 1,956 1.557 11.650 4,013 2.841 1.890 542 875 1.881 283 6.553 1,104 352 (1,023 160.187 239,753 73,908 8,796 18.763 22,481 128.150 42.783 29,673 24.879 5.340 9.430 22,398 2,587 70,345 4,470 863,943 184.986 246,391 72,013 9,561 21,511 17,123 128.150 44,144 31.246 20,789 5.958 9,625 20,689 3,117 72,078 4,858 892.240 1,361 1,573 (4.090) 173.536 259,732 80,067 9,529 20.327 24,354 138.829 46,348 32.146 26.952 5.785 10.216 24.265 2,803 76.207 4,842 935.938 201.803 268.790 78,560 10.430 23.467 18,680 139,800 48,157 34.087 22.679 6,500 10.500 22.570 3.400 78,630 5,300 973,353 971 1,809 1941 (4.273) 715 618 195 (1.709 284 (1.695 530 597 2.423 493 442 (52) 9,041 1,733 389 28.298 72,073 81,113 37415 Total Expense 229,546 242.439 12,893 2,596,152 2,666,824 70,672 2,812,498 2,909,263 96.765 Excess (or Deficiency) of Revenue over Expenses 17,308 (10,090 27,399 (98,787) 36,010 (134,798) (107,020) 39,284 (146,304)Step by Step Solution
There are 3 Steps involved in it
Step: 1

Get Instant Access to Expert-Tailored Solutions
See step-by-step solutions with expert insights and AI powered tools for academic success
Step: 2

Step: 3
Ace Your Homework with AI
Get the answers you need in no time with our AI-driven, step-by-step assistance
Get Started
Radical Reporting Writing Better Audit Risk Compliance And Information Security Reports
Authors: Sara I. James
1st Edition
1032106042, 978-1032106045