Answered step by step
Verified Expert Solution
Question
1 Approved Answer
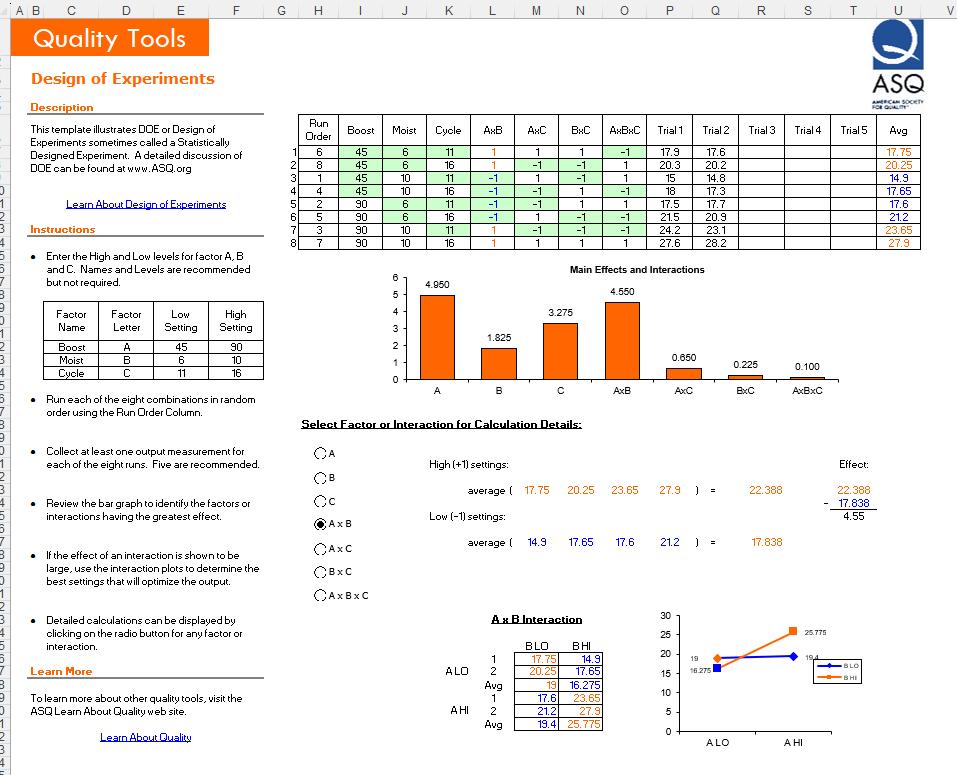
follow the template instructions to run an experiment to find the factors that optimize the output. Post a description of what you found, and attach
follow the template instructions to run an experiment to find the factors that optimize the output. Post a description of what you found, and attach to your post a copy of your template findings?

Note: please do not copy-paste please make sure you rephrase not just summaries if you take an example from other people.
A B C E Quality Tools Design of Experiments Description This template illustrates DOE or Design of Experiments sometimes called a Statistically Designed Experiment. A detailed discussion of DOE can be found at www.ASQ.org Learn About Design of Experiments Instructions . Enter the High and Low levels for factor A, B and C. Names and Levels are recommended but not required. Factor Name Boost Moist Cycle FL Factor Low High Letter Setting Setting A B C 45 6 11 90 10 16 . Run each of the eight combinations in random order using the Run Order Column. Collect at least one output measurement for each of the eight runs. Five are recommended. Review the bar graph to identify the factors or interactions having the greatest effect. If the effect of an interaction is shown to be large, use the interaction plots to determine the best settings that will optimize the output. Detailed calculations can be displayed by clicking on the radio button for any factor or interaction. Learn More To learn more about other quality tools, visit the ASQ Learn About Quality web site. Learn About Quality G 1 H 2 6 8 3 1 4 4 5 2 6 5 7 3 8 7 Run Order CB Co I Boost Moist 6 6 10 10 6 SSSSAAAA Ax B 6 CAXC CBXC CAXBXC ON WAGO 5 4 3 2 1 J 0 6 10 10 K Cycle F9F 16 11 16 11 16 11 16 4.950 L AxB 1 1 -1 -1 -1 -1 1 1 1.825 ALO B High (+1) settings: AHI Low (-1) settings: M AxC 1 -1 Select Factor or Interaction for Calculation Details: 1 -1 -1 1 average (17.75 average ( 14.9 1 2 -1 1 Avg 1 2 Avg 3.275 C N BxC 1 -1 -1 1 1 -1 -1 1 17.6 21.2 19.4 A x B Interaction 20.25 BLO BHI 17.75 20.25 O Main Effects and Interactions 14.9 17.65 19 16.275 23.65 27.9 25.775 AxBxC Trial 1 -1 1 17.9 20.3 15 18 17.5 21.5 24.2 27.6 1 -1 1 -1 -1 1 4.550 17.65 17.6 AxB P 23.65 30 28 229 25 27.9 ) = 20 21.2 ) = 15 10 0.650 5 AxC 0 Trial 2 17.6 20.2 14.8 17.3 17.7 20.9 Q 23.1 28.2 19 16.275 ALO R Trial 3 0.225 BxC 22.388 17.838 S Trial 4 0.100 AxBxC A HI 25.775 19,4 T U Trial 5 Effect: BLO ASQ 22.388 17.838 4.55 -I AMERICAN SOCIETY FOR QUALITY Avg 17.75 20.25 14.9 17.65 17.6 21.2 23.65 27.9
Step by Step Solution
★★★★★
3.34 Rating (154 Votes )
There are 3 Steps involved in it
Step: 1
To conduct an experiment to find the factors that optimize the output a Design of Experiments DOE approach can be used The DOE approach allows for the ...
Get Instant Access to Expert-Tailored Solutions
See step-by-step solutions with expert insights and AI powered tools for academic success
Step: 2

Step: 3

Ace Your Homework with AI
Get the answers you need in no time with our AI-driven, step-by-step assistance
Get Started


