

Answered step by step
Verified Expert Solution
Question
1 Approved Answer
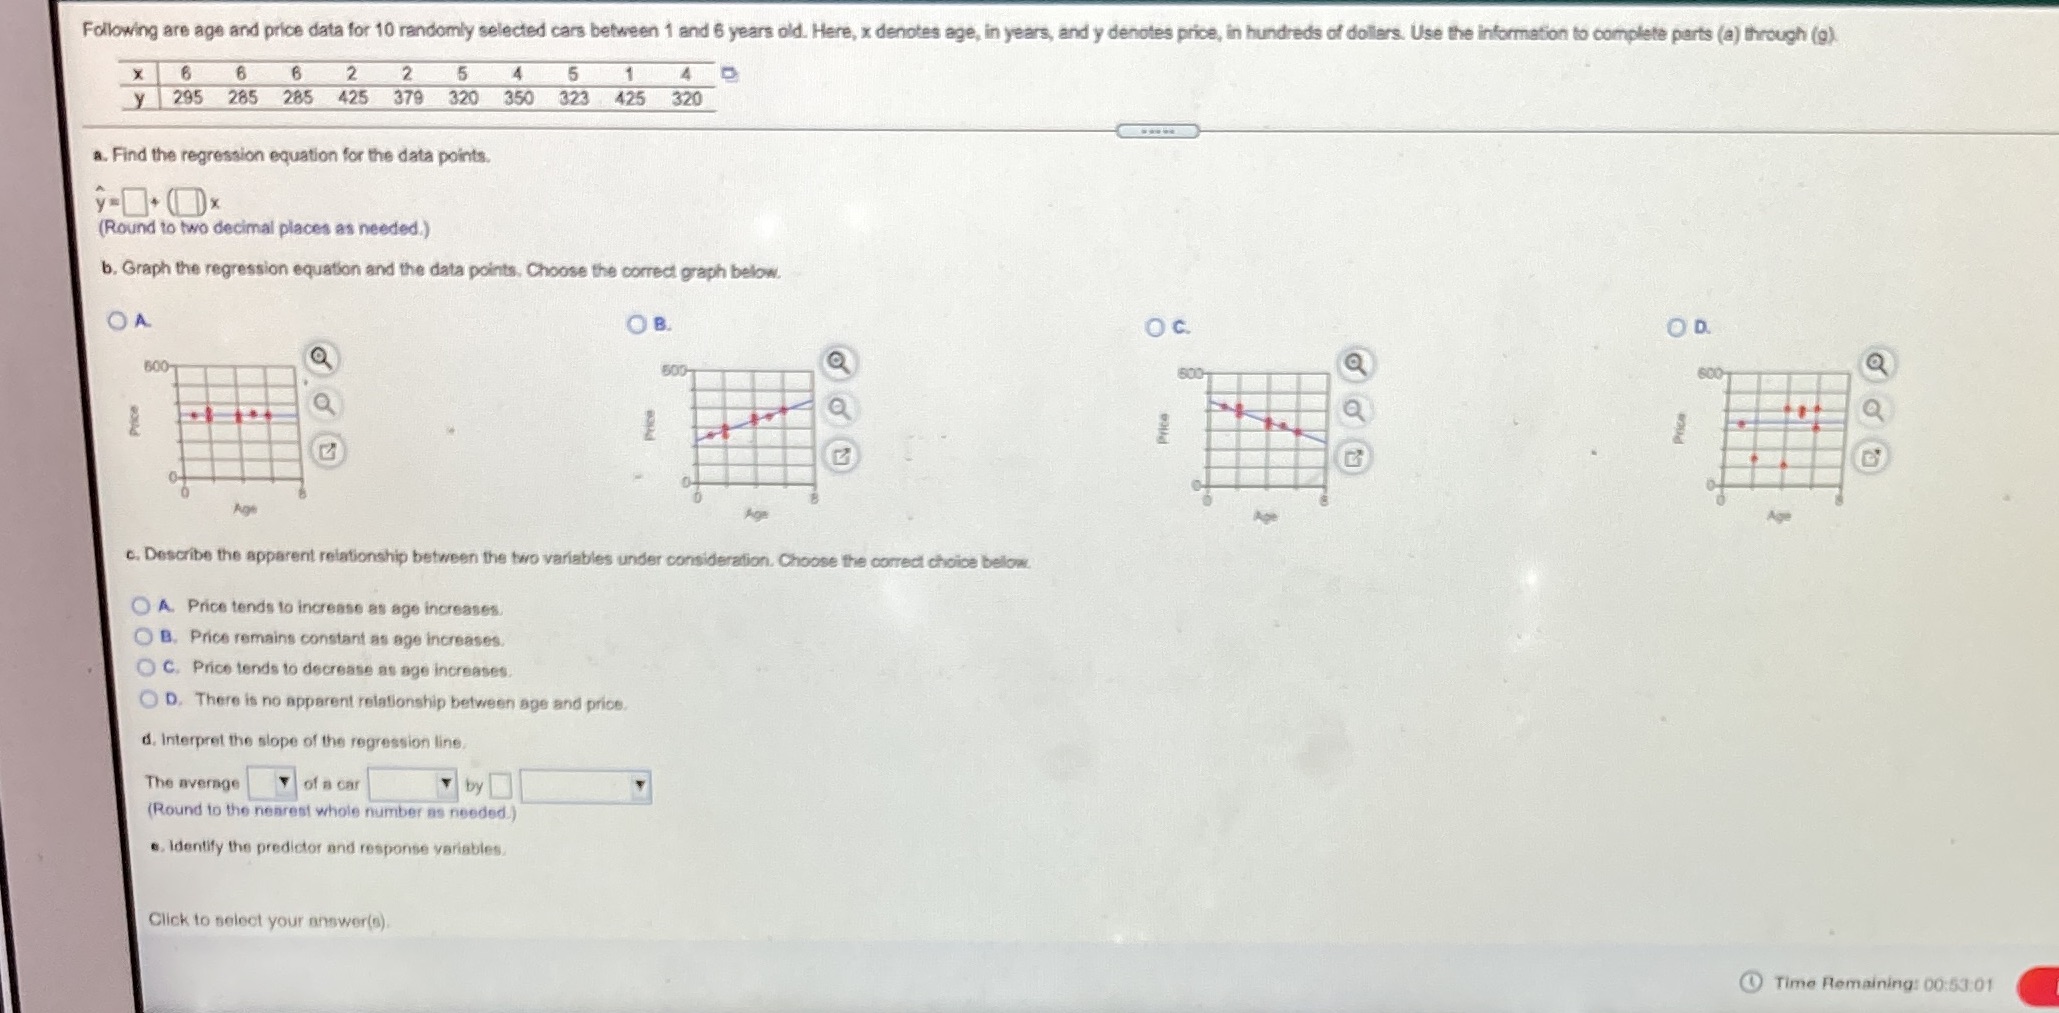
Following are age and price data for 10 randomly selected cars between 1 and 6 years old. Here, x denotes age, in years, and y
Step by Step Solution
There are 3 Steps involved in it
Step: 1

Get Instant Access to Expert-Tailored Solutions
See step-by-step solutions with expert insights and AI powered tools for academic success
Step: 2

Step: 3
Ace Your Homework with AI
Get the answers you need in no time with our AI-driven, step-by-step assistance
Get Started
Discrete Mathematics, Revised
Authors: Seymour Lipschutz, Marc Lipson
3rd Edition
0071615873, 9780071615877