Answered step by step
Verified Expert Solution
Question
1 Approved Answer
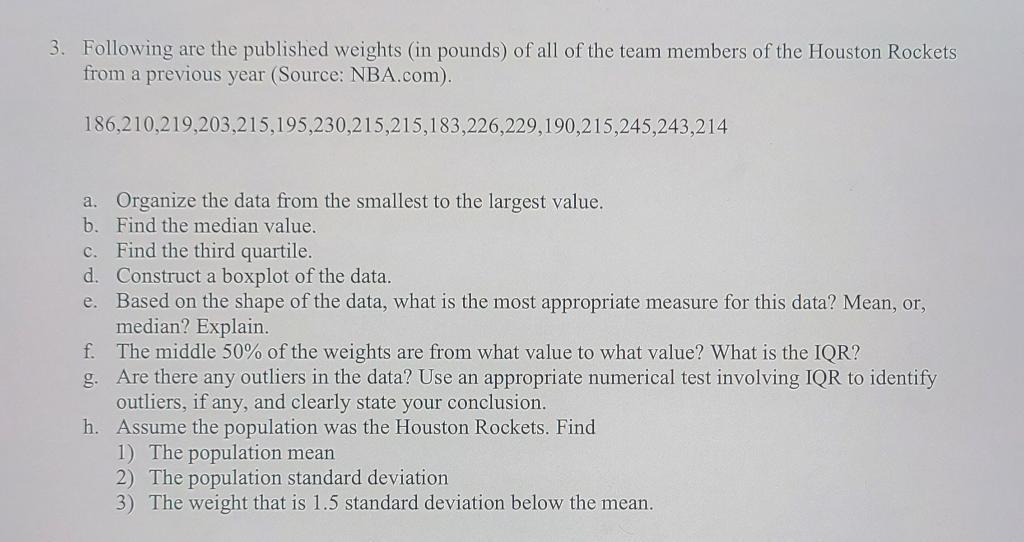
3. Following are the published weights (in pounds) of all of the team members of the Houston Rockets from a previous year (Source: NBA.com).

3. Following are the published weights (in pounds) of all of the team members of the Houston Rockets from a previous year (Source: NBA.com). 186,210,219,203,215,195,230,215,215,183,226,229,190,215,245,243,214 a. Organize the data from the smallest to the largest value. b. Find the median value. c. Find the third quartile. d. Construct a boxplot of the data. e. Based on the shape of the data, what is the most appropriate measure for this data? Mean, or, median? Explain. The middle 50% of the weights are from what value to what value? What is the IQR? Are there any outliers in the data? Use an appropriate numerical test involving IQR to identify outliers, if any, and clearly state your conclusion. Assume the population was the Houston Rockets. Find f. g. h. 1) The population mean 2) The population standard deviation 3) The weight that is 1.5 standard deviation below the mean.
Step by Step Solution
★★★★★
3.44 Rating (157 Votes )
There are 3 Steps involved in it
Step: 1

Get Instant Access to Expert-Tailored Solutions
See step-by-step solutions with expert insights and AI powered tools for academic success
Step: 2

Step: 3

Ace Your Homework with AI
Get the answers you need in no time with our AI-driven, step-by-step assistance
Get Started


