

Answered step by step
Verified Expert Solution
Question
1 Approved Answer
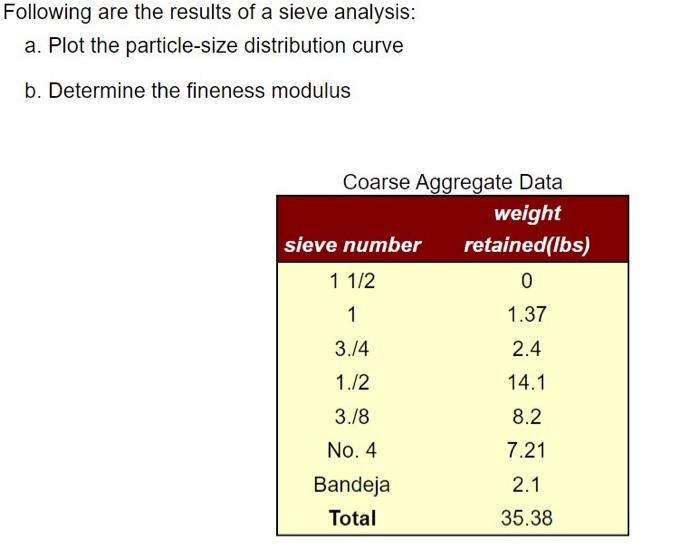
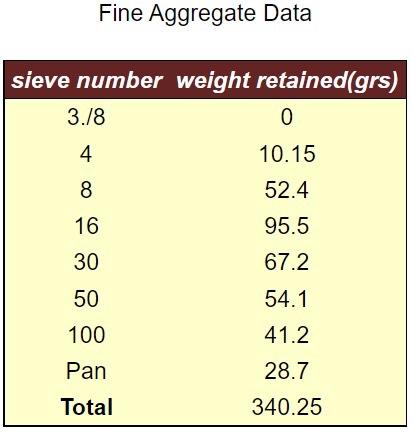
Following are the results of a sieve analysis: a. Plot the particle-size distribution curve b. Determine the fineness modulus Coarse Aggregate Data weight sieve number
Step by Step Solution
There are 3 Steps involved in it
Step: 1

Get Instant Access to Expert-Tailored Solutions
See step-by-step solutions with expert insights and AI powered tools for academic success
Step: 2

Step: 3
Ace Your Homework with AI
Get the answers you need in no time with our AI-driven, step-by-step assistance
Get Started
Working Capital Management Applications And Case Studies
Authors: James Sagner
1st Edition
1118933834,1118933850