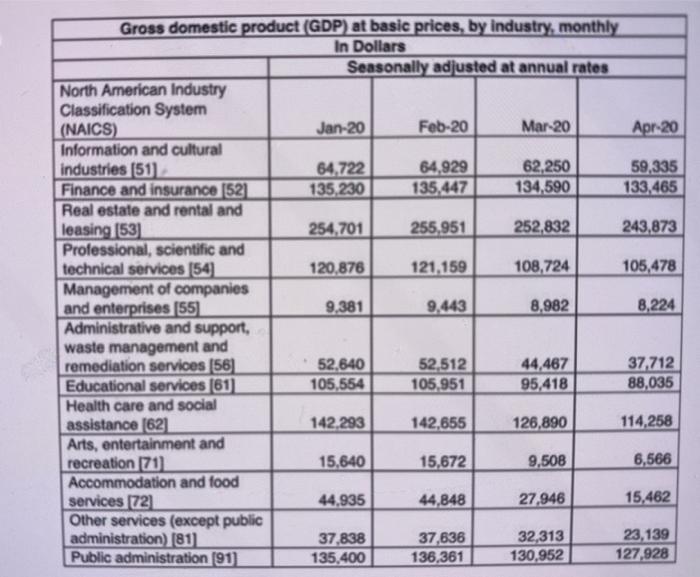
Following is the data of Gross domestic product (GDP) at basic prices, by_industry, monthly different industries for four different Months. Create the frequency distribution by using appropriate intervals and graph them in various charts to describe the pattern in different places during the period of four months. Find the measure of central tendency and Measures of dispersion for the data. Use these data to compute the average monthly Gross domestic product (GDP) at basic prices, by industry, for the period four months of the year 2020 separately as well as combined. Compute the standard deviation for the data. Find out the mean, median and standard deviation of the individual item. Now think about what these numbers are saying. The average tells us about how GDP varies. The standard deviation tells us how much variation is associated with that quantity, from month to month. In financial terms, it is one measure of risk. Which month has higher return? Higher-risk? Write a short paragraph giving your means and standard deviations and commenting on what they mean. Gross domestic product (GDP) at basic prices, by industry, monthly In Dollars Seasonally adjusted at annual ratos North American Industry Classification System (NAICS) Jan-20 Feb-20 Mar 20 Apr-20 Information and cultural industries (51) 64,722 64,929 62,250 59,335 Finance and insurance (52) 135,230 135,447 134,590 133,465 Real estate and rental and leasing (53) 254,701 255.951 252,832 243,873 Professional, scientific and technical services (54) 120.876 121.159 108,724 105,478 Management of companies and enterprises (55) 9.381 9.443 8.982 8,224 Administrative and support, waste management and remediation services (56) 52,840 52,512 44,467 37,712 Educational services (61) 105,554 105,951 95,418 88,035 Health care and social assistance (62) 142,293 142,655 126,890 114,258 Arts, entertainment and recreation 71 15,640 15,672 9,508 6,566 Accommodation and food services 172 44,935 44,848 27,946 15,462 Other services (except public administration) (81) 37,838 37,636 32,313 23,139 Public administration (91) 135,400 136.361 130,952 127,928 Following is the data of Gross domestic product (GDP) at basic prices, by_industry, monthly different industries for four different Months. Create the frequency distribution by using appropriate intervals and graph them in various charts to describe the pattern in different places during the period of four months. Find the measure of central tendency and Measures of dispersion for the data. Use these data to compute the average monthly Gross domestic product (GDP) at basic prices, by industry, for the period four months of the year 2020 separately as well as combined. Compute the standard deviation for the data. Find out the mean, median and standard deviation of the individual item. Now think about what these numbers are saying. The average tells us about how GDP varies. The standard deviation tells us how much variation is associated with that quantity, from month to month. In financial terms, it is one measure of risk. Which month has higher return? Higher-risk? Write a short paragraph giving your means and standard deviations and commenting on what they mean. Gross domestic product (GDP) at basic prices, by industry, monthly In Dollars Seasonally adjusted at annual ratos North American Industry Classification System (NAICS) Jan-20 Feb-20 Mar 20 Apr-20 Information and cultural industries (51) 64,722 64,929 62,250 59,335 Finance and insurance (52) 135,230 135,447 134,590 133,465 Real estate and rental and leasing (53) 254,701 255.951 252,832 243,873 Professional, scientific and technical services (54) 120.876 121.159 108,724 105,478 Management of companies and enterprises (55) 9.381 9.443 8.982 8,224 Administrative and support, waste management and remediation services (56) 52,840 52,512 44,467 37,712 Educational services (61) 105,554 105,951 95,418 88,035 Health care and social assistance (62) 142,293 142,655 126,890 114,258 Arts, entertainment and recreation 71 15,640 15,672 9,508 6,566 Accommodation and food services 172 44,935 44,848 27,946 15,462 Other services (except public administration) (81) 37,838 37,636 32,313 23,139 Public administration (91) 135,400 136.361 130,952 127,928


